Shopify Inc.
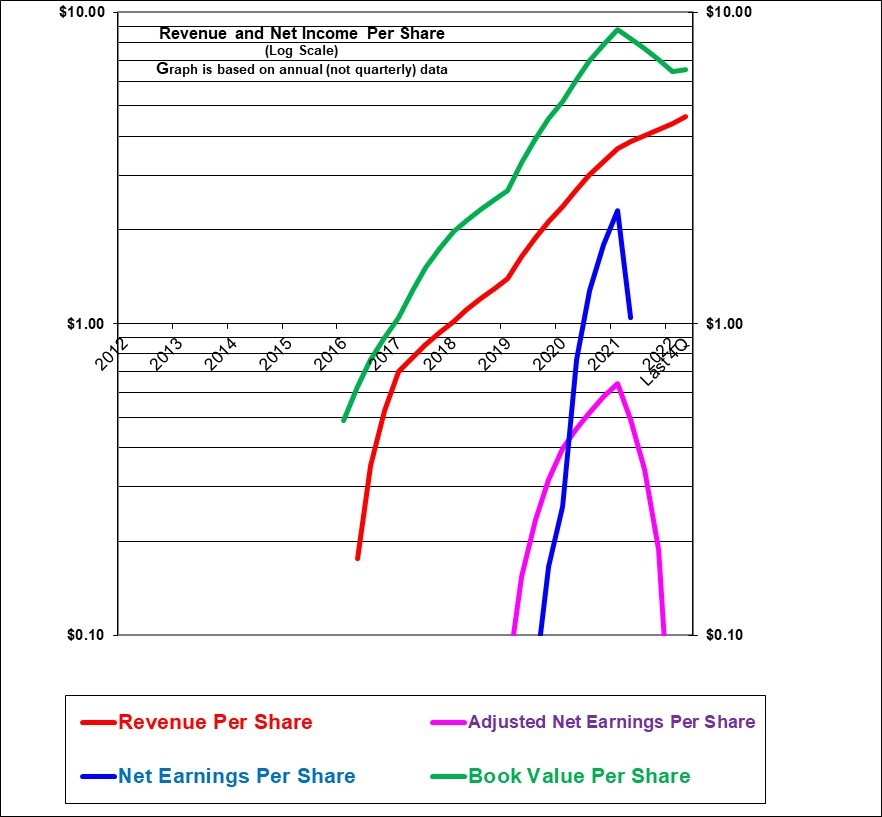
Shopify’s initial public offering was in 2015 and so our graph has less than 10 years of data. Revenues per share had been increasing extremely rapidly in the range of 40% annually. And that surged to 80% growth in 2020 with the pandemic boost to online shopping and grew a further 51% in 2021. But revenue per share growth has now slowed to about 20%. Adjusted earnings per share had also risen rapidly although initially from very low levels but then plummeted in 2022. Analysts expect strong profits in 2023 but well short of the 2021 level. Book value per share (the green line here) had increased in the earlier years due to share sales at high multiples and despite reporting losses on a GAAP basis.
|
Shopify Inc. (SHOP, on Toronto and U.S.) |
|
|
RESEARCH SUMMARY |
|
|
Report Author(s): |
InvestorsFriend Inc. Analyst(s) |
|
Author(s)’ disclosure of share ownership: |
The Author(s) hold no shares |
|
Based on financials from: |
Dec ’22 Y.E. +Q1 ’23 |
|
Last updated: |
June 3, 2023 |
|
Share Price At Date of Last Update: |
$ 65.10 |
|
Currency: |
$ U.S. |
|
Generic Rating (This rating does not consider the circumstances of any individual investor and is therefore not specific advice for any individual): |
Highly Speculative Hold at $U.S. $65.10 |
|
Qualifies as a stock that could be bought with confidence to hold for 20 years? |
Probably, but depends if it is too expensive today. |
|
Has Wonderful Economics? |
Yes |
|
Has Excellent and Trustworthy Management? |
Yes |
|
Likely to grow earnings per share at an attractive rate over the next decade? |
Yes |
|
Positive near-term earnings outlook? |
Probably yes, from a low starting point |
|
Valuation? |
Extremely expensive (16 times revenue) |
|
SUMMARY AND RATING: This company has achieved staggeringly huge growth in revenues. And it began to generate material profits in 2020 and 2021 although the adjusted was very low in 2022. It has expanded extremely ambitiously around the world. The Value ratios would suggest a rating of “Sell” given a price to sales ratio of 14 and an analyst forward P/E of 189. Management quality appears to be excellent. The insider trading signal is somewhat negative but is not an important indicator. Executive compensation is generous but not of concern given the market value of the company. The outlook is for continued very strong growth perhaps in the range of 20% or more for revenue and with profits likely to soon become a material percentage of sales. The economics of the business appear to be excellent with a high gross profit and almost certainly an extremely “sticky” customer base. Given the quality of the company but considering that the value ratios seem extreme it is clear that this would be a Speculative investment. The share price has declined about 60% versus its peak around U.S. $170 during the pandemic when so much shopping moved online. But the stock is also now up 170% from its 2022 lows. We would not make this a very large portion of a portfolio at this valuation. This is a fantastic company but the valuations is difficult to judge. Those with larger positions might be wise to trim some now while keeping some for the long-term potential. Our overall rating is “Speculative Hold”. |
|
|
MACRO ENVIRONMENT: There has been some return to bricks and mortar shopping which led to lower growth for Shopify. And a potential looming recession could also slow growth. |
|
|
LONG TERM VALUE CREATION: (Updated June 16, 2023) On an accounting basis Shopify has only recently began to create much value (2020, 2021 but not much in 2022). But that at least partly illustrates a failing of accounting rules to recognise the value created. On a market value basis it has clearly created staggeringly huge value for earlier investors and especially for its earliest investors (prior to the IPO) and huge value for its IPO investors as well and has created very good value even for relatively recent investors – but not for those who bought at the highest prices. Some recent purchasers have lost substantial value. |
|
|
DESCRIPTION OF BUSINESS: Shopify describes it self as “the leading cloud-based, multi-channel (Online as well as bricks and mortar plus more) commerce platform for retail businesses of any size” (Previously they used to say for small and medium-sized businesses). “The company’s mission is to make commerce better for everyone”. Shopify enables businesses to set up online and provides the associated services and software. They offer a full service solution including payment acceptance, point of sale card readers, inventory management, shipping, sales reporting, sales tax tracking and collection, financing (lending) of working capital and more. They also include managing sales at physical locations with the same software. The large majority of their merchants are on plans that cost less than $50 per month – yet are highly scalable. Shopify serves about 2 million merchants located world wide. In 2022 revenues were 66% from the U.S., 6% in Canada, 16% Europe, middles east, Africa, and 10% from Asia Pacific. There is a large network of app developers with over 6000 apps available in their app store. In 2012, 27% of Shopify’s revenue was collected from recurring monthly subscription fees. The remainder was collected mostly on the basis of the volume of sales (including mainly payment processing fees and currency conversions fees and also transaction fees based on sales for merchants not using Shopify for payment processing) that its merchants achieved and is also likely to be essentially a recurring revenue stream. |
|
|
ECONOMICS OF THE BUSINESS: Shopify has very strong economics in that its gross profit level is about 54% (this for 2021) and it does not require a large investment in productive assets compared to revenue. And its customer base is likely to be extremely loyal due to the fact that Shopify’s software and services are at the very heart of its customer’s business. |
|
|
RISKS: The company lists numerous risks. The share price is anticipating continued huge growth for the company and any failure to achieve rapid growth is a risk to the share price. Data breaches and cyber attacks and business interruption are important risks. See annual report for other risks. |
|
|
INSIDER TRADING / INSIDER HOLDING: There has been substantial and regular insider selling. This is almost entirely after exercising options at low prices and is done regularly “under a plan”. Insiders have made HUGE gains. While not unexpected, we would still consider the selling to be a somewhat negative insider trading signal. |
|
|
WARREN BUFFETT’s CRITERIA: Buffett indicates that all investments must pass four key tests: the business is simple to understand and predict (at least a marginal pass because shoofly’s software services are not that complex to understand and their customers will tend to be very sticky but the growth rate would be difficult to anticipate), has favorable long-term economics due to cost advantages or superior brand power (pass given its high gross profit margin), apparently able and trustworthy management (pass), a sensible price – below its intrinsic value (this is hard to say at this time but without heroic growth assumptions is probably a fail), Other criteria that have been attributed to Buffett include: a low debt ratio (pass, it has modest debt and far more cash than debt), good recent profit history (fail) little chance of permanent loss of the investors capital (possible fail given the high valuation in relation to revenues) a low level of maintenance type capital spending required to maintain existing operations excluding growth (pass) |
|
|
MOST RECENT EARNINGS AND SALES TREND: Revenues per share growth in the past four quarters beginning with Q1 2023 was 22%, 24%, 22% and 17%. In 2022, the revenue per share growth was 21% as the extreme growth of the pandemic period cooled. In 2021 revenue per share growth was 53%. In 2020 revenue per share growth was 70%. In 2019 the revenue per share growth was 37%. In 2018 the growth was 44%. This is incredibly strong growth. Adjusted earnings per share had been negative or very low but turned meaningfully positive in 2020 and 2021 but returned down to near-zero in 2022. Previous losses and low adjusted profits may have been due to the requirement to expense the millions spent on R&D and software development and on marketing both of which in reality constitute investments in intangible assets to benefit future years. The revenue growth here had been extremely strong and continues now at lower but still strong levels. |
|
|
COMPARABLE STORE SALES OR INDUSTRY SPECIFIC STATISTICS: As of Q3 2021 Shopify indicates that “Shopify powers over 1.7 million businesses in 175 countries”. |
|
|
Earnings Growth Scenario and Justifiable P/E: With the shares trading at 14 times REVENUE and with the Analyst forward P/E 189, Shopify is clearly pricing in a very high rate indeed of growth of earnings per share. |
|
|
VALUE RATIOS: Analysed at a share price of $65.10 U.S. Shopify had become meaningfully profitable (using its reported adjusted earnings) in 2020 and 2021 but slipped back to a low profit level in 2022 although low profits were partly or largely due to accounting rules that required it to expense marketing and R&D and software creation spending much of which is creating long-term value. Since the company is growing so rapidly, the value ratios may not be very relevant. The price to book ratio of 10.0 times is ostensibly unattractively high and basically assumes that the company will ultimately achieve a very high return on equity. The 10.0 times P/B ratio results in the $8.5 billion of book equity trading at a value of $84 billion. That is a very large premium indeed – but book value may be substantially under-stated due to the conservative accounting rules just mentioned. The P/E ratio based on trailing adjusted earnings is meaningless due to very low trailing year earnings. The P?E ratio based on analyst forecast earnings is unattractively very high at 189. If we look at the price to sales ratio it is unattractively very high at 14 times. The stock appears to be very richly valued which could certainly support a rating of Sell. But it is possible that revenues will continue to rise rapidly and ultimately justify the stock price. This is a case where value ratios may not be of much relevance. |
|
|
TAXATION: Nothing unusual, share owners would expect to pay capital gains taxes if the shares are sold at a profit. |
|
|
SUPPORTING RESEARCH AND ANALYSIS |
|
|
Symbol and Exchange: |
Shopify |
|
Currency: |
$ U.S. |
|
Contact: |
ir@shopify.com |
|
Web-site: |
www.shopify.com |
|
INCOME AND PRICE / EARNINGS RATIO ANALYSIS |
|
|
Latest four quarters annual sales $ millions: |
$5,904.0 |
|
Latest four quarters annual earnings $ millions: |
$(1,918.0) |
|
P/E ratio based on latest four quarters earnings: |
negative |
|
Latest four quarters annual earnings, adjusted, $ millions: |
$35.0 |
|
BASIS OR SOURCE OF ADJUSTED EARNINGS: Used management’s view of adjusted net income even though it adds back stock-based compensation which we normally would never add back. We also added back an unusual income tax item in 2019. |
|
|
Quality of Earnings Measurement and Persistence: The adjusted earnings figure appears to be reasonably measured except we don’t like that they add back stock-based compensation. It’s too early to comment on the persistence of adjusted earnings. |
|
|
P/E ratio based on latest four quarters earnings, adjusted |
2,369.6 |
|
Latest fiscal year annual earnings: |
$(3,460.0) |
|
P/E ratio based on latest fiscal year earnings: |
negative |
|
Fiscal earnings adjusted: |
$47.6 |
|
P/E ratio for fiscal earnings adjusted: |
1,742.9 |
|
Latest four quarters profit as percent of sales |
0.6% |
|
Dividend Yield: |
0.0% |
|
Price / Sales Ratio |
14.05 |
|
BALANCE SHEET ITEMS |
|
|
Price to (diluted) book value ratio: |
9.95 |
|
Balance Sheet: (updated based on Q1 2023 report) Shopify is valued for its potential earnings and not for its assets. Nevertheless, the composition of its balance sheet may be of interest. Actually, the balance sheet is unusual because they have issued shares at high prices and are holding a massive amount of cash and cash equivalents. 29% of its assets consist of short-term marketable securities. A further 16% is cash. That totals 45% in cash and near-cash. But that amounts to just $3.77 per share which is very little compared to the stock price. But these billions give the company a huge war chest. 21% of assets are equity and other investments. 17% is purchased goodwill. 6% is loans to merchants to finance their receivables, 4% is other current receivables and other current assets. Less than 1% of assets is property and equipment which is mostly leasehold improvements but also computer equipment and furniture, 3% is intangible assets which is mostly purchased technology and software but also some purchased customer relationship value. It’s most valuable asset by far is not recorded as an asset because most or all of the expense of developing its software has been expenses as incurred which was likely required by accounting rules. These assets are financed as follows: 77% by shareholder equity, 8% by a convertible debenture, 5% by accounts payable, 3% by deferred revenue and 4% by lease liabilities. With modest debt and a huge amount of cash and marketable securities this is an extremely strong balance sheet. Shopify has basically sold shares at high prices and built up a huge “war chest” presumably to fund growth. It’s also worth remembering that its own created software is BY FAR its biggest asset and yet it does not appear on the balance sheet due to accounting rules. |
|
|
Quality of Net Assets (Book Equity Value) Measurement: With the shares trading at about 10 times book value, the value of the assets is not really relevant to valuation. However, the assets do have solid value in that they are mostly marketable securities and cash. But the company is valued for its future cash flows and growth potential, not its tangible assets. |
|
|
Number of Diluted common shares in millions: |
1,292.0 |
|
Controlling Shareholder: The founder and CEO, Tobias Lutke, owns 34% of the voting power by owning 66% of the Class B multiple vote shares. This amounts to 6.4% of the total shares. A director owns 16% of the voting power by owning 31% of the multiple voting shares which amounts to 3.0% of the total shares. The class B multiple voting shares in total controlled about 52% of the votes as of February 2021. |
|
|
Market Equity Capitalization (Value) $ millions: |
$84,109.2 |
|
Percentage of assets supported by common equity: (remainder is debt or other liabilities) |
77.1% |
|
Interest-bearing debt as a percentage of common equity |
11% |
|
Current assets / current liabilities: |
6.7 |
|
Liquidity and capital structure: (Updated for Q1 2023 report) Shopify has extremely good liquidity and an extremely strong balance sheet as it has an astounding $4.9 billion in cash and marketable securities and just 0.9 billion in debt. This is a lower cash level than it had in 2021 but the balance sheet is still absolutely bullet proof. |
|
|
RETURN ON EQUITY AND ON MARKET VALUE |
|
|
Latest four quarters adjusted (if applicable) net income return on average equity: |
0.4% |
|
Latest fiscal year adjusted (if applicable) net income return on average equity: |
0.5% |
|
Adjusted (if applicable) latest four quarters return on market capitalization: |
0.0% |
|
GROWTH RATIOS, OUTLOOK and CALCULATED INTRINSIC VALUE PER SHARE |
|
|
5 years compounded growth in sales/share |
44.3% |
|
Volatility of sales growth per share: |
$ – |
|
5 Years compounded growth in earnings/share |
negative past earnings |
|
5 years compounded growth in adjusted earnings per share |
18.7% |
|
Volatility of earnings growth: |
$ – |
|
Projected current year earnings $millions: |
not available |
|
Management projected price to earnings ratio: |
not available |
|
Over the last ten years, has this been a truly excellent company exhibiting strong and steady growth in revenues per share and in (adjusted) earnings per share? |
Yes |
|
Expected growth in EPS based on adjusted fiscal Return on equity times percent of earnings retained: |
0.5% |
|
More conservative estimate of compounded growth in earnings per share over the forecast period: |
30.0% |
|
More optimistic estimate of compounded growth in earnings per share over the forecast period: |
40.0% |
|
OUTLOOK AND AMBITIONS FOR BUSINESS: For Q2, 2023, Shopify forecasts revenue growth of about 20%. Shopify remains very ambitious for future growth. If seems likely that bottom line adjusted profits will remain low in the near term. |
|
|
LONG TERM PREDICTABILITY: Shopify appears to have established a strong leading position in its market. We would expect its customers to be loyal due to the inconvenience of switching online sales platforms. Overall, we would expect Shopify to prosper over the years. (The share price performance however is far les predictable.) |
|
|
Estimated present value per share: Shopify is growing extremely rapidly and it is very difficult to estimate its earnings growth. With recent very low adjusted profit it is not possible to estimate its intrinsic value based on any reasonable growth rate in that profit. |
|
|
ADDITIONAL COMMENTS |
|
|
INDUSTRY ATTRACTIVENESS: (These comments reflect the industry and the company’s particular incumbent position within that industry segment.) Michael Porter of Harvard argues that an attractive industry is one where firms are somewhat protected from competition based on the following four tests. Barriers to entry (Pass, as a large investment would be needed to enter this business). No issues with powerful suppliers (pass). No issues with dependence on powerful customers (pass), No potential for substitute products (pass) No tendency to compete ruinously on price (pass). Overall this industry appears to be very attractive for an established incumbent. |
|
|
COMPETITIVE ADVANTAGE: Shopify may have a huge advantage as (we understand) the first large player in this market. Due to the way their service becomes the heart of their merchant customer’s businesses, it may be very difficult for competitors to lure customers away. A key feature is that unlike selling on Amazon, merchants keep their own brand identify. |
|
|
COMPETITIVE POSITION: We believe Shopify has a leading position in the market but we are not aware of its market share or the identity of its main competitors. Its market is huge and growing as almost very business adopts an e-commerce presence. |
|
|
RECENT EVENTS: Shopify has embraced a “digital-by-default” approach and indicates that most of its employees will continue to work remotely. Therefore they have reduced their leased space and sublet substantial space and plan to continue of that path. In early June 2023 Shopify downsized by 20% by selling the majority of its logistics business (which will remain its preferred logistics partner under the new ownership) and also by reducing management staff. This includes Delivererr which was only acquired in mid-2022. Headcount was reduced by 10% in the summer of 2022. The intention was to make Shopify better able to focus on its core mission and business. Shopify will retain an equity investment in this business. Shopify continues to roll out various improvements to its Software and new software products. This includes point of sale revenue acceptance, tax compliance products, logistics products and more. In 2021 it sold (or at least realized) an investment in another company at a large gain. In January 2021 issued $1.5 billion in shares at U.S. $ 1315. In September 2020 issued $1.14 billion in shares at U.S $900. And, in September 2020 issued $0.9 billion in a convertible not, paying next to nothing (0.125%) but convertible at U.S. $1440 (which at the time was 60% higher than the share price offering). In May 2020 issued $1.5 billion in shares at U.S. $700. This all added greatly to its huge “war chest” of cash and near-cash totalling now $7.9 billion. |
|
|
ACCOUNTING AND DISCLOSURE ISSUES: It’s likely that GAAP and also adjusted earnings are substantially under-stated due to the requirement to expense all or substantially all R&D (and software development costs if that is not included in R&D) and marketing expenses even though some of those expenditures will benefit future years and are therefore assets in substance. The company adds back all stock-based compensation in calculating adjusted earnings. Most companies do that but it is fundamentally wrong in our opinion in that it implies that giving out stock options costs the company and its existing owners nothing. Be aware that most of its 2021 GAAP profit was due to a large unrealized gain on investment in a private company that has gone public at a strong valuation. |
|
|
COMMON SHARE STRUCTURE USED: Unfortunately, Shopify has a dual share structure whereby it is controlled through multiple voting shares. The shares that that trade have only one tenth the voting power of each multiple voting share. |
|
|
MANAGEMENT QUALITY: We would judge management quality to be extremely high. They have created an enormously valuable company in a short period of time and have continued to pursue huge growth. We believe they have also been very astute in issuing more shares to the public on several occasions to raise a huge “war chest” of cash. The trade off between the amount of cash raised, and the strength and opportunities that the cash provides, and the level of dilution of the future expected profits was probably a very good trade-off. |
|
|
Capital Allocation Skills: We would rate these skills highly. Management’s decision to invest in software and research to create and grow Shopify has been extremely beneficial. In addition their decisions at the time of the IPO and on subsequent occasions to issue shares and raise very substantial amounts of capital appear to have been very astute. |
|
|
EXECUTIVE COMPENSATION: (Updated based on the circular from April 2021) Compensation for the top 5 officers for 2020 was largely in the form of share-based and options-based and ranged from $6 million to $20 million. This compensation is not a concern given the $84 billion market value of the company as of June 16, 2023. But it’s interesting that there was little or no reduction in light of the far lower profits in 2022. |
|
|
BOARD OF DIRECTORS: Warren Buffett has suggested that ideal Board members be owner-oriented, business-savvy, interested and financially independent. The Board here has just six members. Most of the directors hold millions of dollars worth of shares and therefore we have owners in charge of the business. Overall the Board may lack depth and independence. |
|
|
Basis and Limitations of Analysis: The following applies to all the companies rated. Conclusions are based largely on achieved earnings, balance sheet strength, achieved earnings per share growth trend and industry attractiveness. We undertake a relatively detailed analysis of the published financial statements including growth per share trends and our general view of the industry attractiveness and the company’s growth prospects. Despite this diligence our analysis is subject to limitations including the following examples. We have not met with management or discussed the long term earnings growth prospects with management. We have not reviewed all press releases. We typically have no special expertise or knowledge of the industry. |
|
|
DISCLAIMER: All stock ratings presented are “generic” in nature and do not take into account the unique circumstances and risk tolerance and risk capacity of any individual. The information presented is not a recommendation for any individual to buy or sell any security. The authors are not registered investment advisors and the information presented is not to be considered investment advice to any individual. The reader should consult a registered investment advisor or registered dealer prior to making any investment decision. For ease of writing style the newsletter and articles are often written in the first person. But, legally speaking, all information and opinions are provided by InvestorsFriend Inc. and not by the authors as individuals. The author(s) of this report may have a position, as disclosed in each report. The authors’ positions may subsequently change without notice. |
|
|
© Copyright: InvestorsFriend Inc. 1999 – 2023. All rights to format and content are reserved. |
|