
Imagine you want to save and invest your way to having one million dollars. And let’s also require that this be a million in today’s dollars.
How much would you have to save and invest each year and how many years would it take to get to a million dollars (in today’s dollars, adjusted for inflation)?
Based on past stock market performance (S&P 500 total return index which includes dividends), it turns out that if you want to get to a million dollars (adjusted for inflation) in 30 years, you have to invest about $15,000 per year. Since we want to get to a million in today’s dollars you also have to increase the amount saved to account for inflation each year.
The following graph shows what would have happened to people who started out and saved $15,000 per year, adjusted up each year for inflation. Each line on the graph is a different 30-year period. There is a line for 1926 through 1955, a line for 1927 – 1956, for 1928 – 1957 etc. all the way to 1982 – 2011. The money here is invested in the S&P 500 index and is in a tax-free account. Dividends are included. Any trading or money management costs are not accounted for.
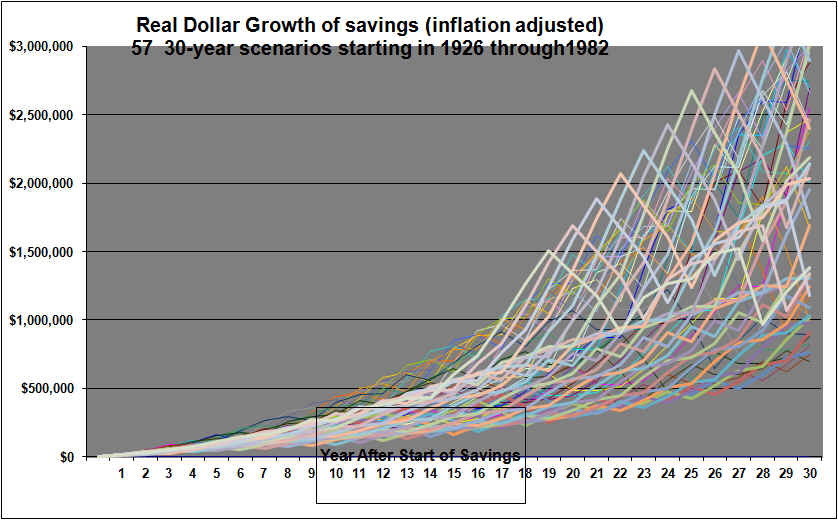
The graph shows that in the great majority of the cases the portfolios reached at least one million. There were more cases that exceeded two million than there were that failed to reach one million. Cases that failed to get to one million were 1945 – 1974, 1949 -1978, 1950 – 1979, 1951 – 1980, 1952 – 1981, 1953 – 1982, 1954 – 1983, 1955 – 1984, 1956 – 1985, 1958 – 1987. The worse case was 1952 – 1981 which reached $693,678.
The savings portfolios that were started in the 50’s initially saw very strong returns but were badly hurt in the 70’s when stock returns were often deeply negative especially after the high inflation of those years.
Some readers may protest that almost no one had $15,000 peer year to invest in 1926. That is true but given inflation, our 1926 investor would have been happy to accumulate at least $100,000 by investing $1500 per year.
It’s interesting to note that if you want to be reasonably sure of accumulating one million in this fashion you have to save an amount that is likely to result in a lot more than a million. But even though you are highly likely to surpass one million (based on past stock market data) there is still a chance you will fall short.
If 30 years is simply too long, the chart also shows where investors stood after 10 and 20 years etc.
Longer investment period with smaller amount invested:
The task of saving $15,000 per year (and adjusting that upwards each year for inflation), may be far beyond the means of most people. If we extend our savings period to 40 years then the amount saved per year can be substantially reduced.
The graph below is based on saving and investing in stocks for 40 year periods. The amount saved is $6000 per year adjusted upwards each year for inflation. That is $500 per month in today’s dollars and a lot more do-able than is $15,000 per year.
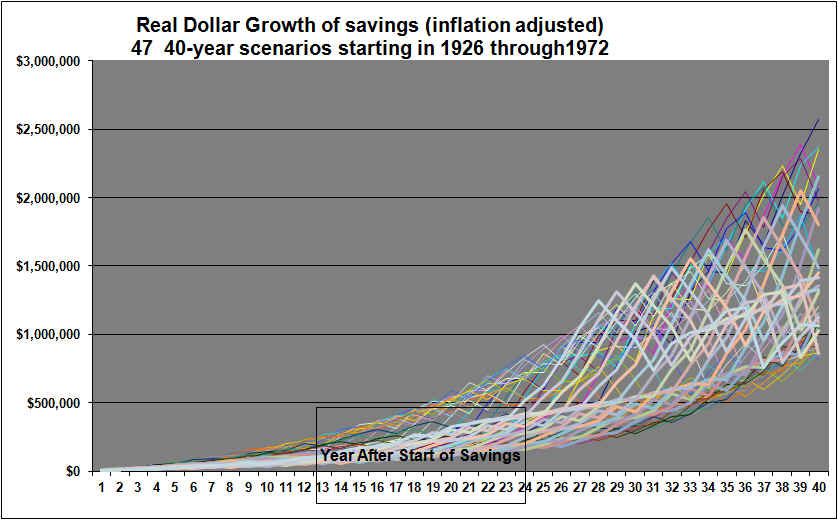
The graph shows that in the great majority of the cases the portfolios reached at least one million. There were about as many cases that exceeded two million as there were that failed to reach one million. Cases that failed to get to one million were 1935 – 1974, 1939 – 1978, 1940 – 1979, 1942-1981, 1943-1982, 1944-1983, 1945-1984, 1951-1990 and 1955- 1994 and 1969-2008. The worse case was 1942 – 1981 which reached $816,000.
If saving $6000 per year is too much you can adjust for that. For example $600 per year would get you to 10% of the figures shown at year 40. You could be relatively sure of getting to $100,000 in 40 years by investing $600 per year or just $50 per month in a stock index fund. (This ignores fees but there are some very low cost index funds available. It also assumes a tax free account).
Conclusions:
If you want to accumulate a million dollars by saving and investing in stocks a constant amount each year (adjusted upwards for inflation) and if the savings period is 30 years you can be relatively confident of not falling short of that mark if the savings amount is $15,000 per year. If the savings period is 40 years you can reduce the savings amount down to $6000 per year and still be relatively confident of reaching one million. This is based on past stock market performance data for all 57 of the 30 year and all 47 of the 40 year calendar periods that have occurred since 1926.
Observations:
In reality no one invests a constant real dollar amount per year for 30 or 40 years. A more realistic scenario is that the amount invested each year would start out small and then rise rapidly in later years. Nevertheless it is informative to see what would have happened to stock investors who saved constant real dollar amounts based on actual past data for stock market returns and inflation.
Most of the lines on the graphs above show very high volatility. Savers experienced sharp drops. For more discussion of the volatility and also for results from balanced portfolios see our article that explores 30-year savings results for all-equity versus balanced approaches.
What if you already have $100,000 in the market?
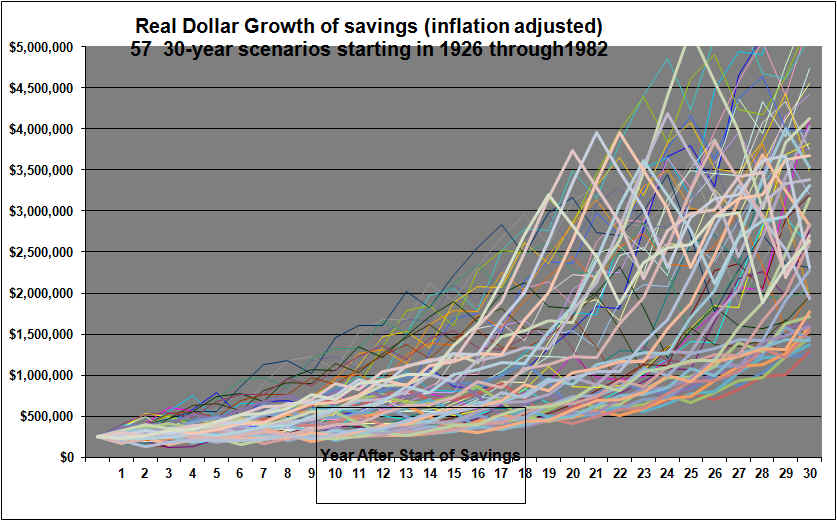
The following graph shows what would have happened to past investors who started with $100,000 and then added $6000 per year (adjusted for inflation). The portfolios values shown in all the graphs in this article are in real dollars adjusted for inflation.

The next graph shows what has happened for those who started out with $250,000 and then invested $6000 per year (adjusted upwards each year to account for inflation). It shows not only where past investors in the S&P 500 index ended up after 30 years but also shows where they stood after 10 years or 20 years etc.
The graphs in this article can give you a sense of what is possible through investing. Some readers may find this to be motivating.
END
Shawn C. Allen, CFA, CMA, MBA, P.Eng.
President, InvestorsFriend Inc.
The data source for the above is a well-known reference book called “Stocks, Bonds, Bills and Inflation” 2012 edition. The book is published annually by Morningstar. (Ibbotson SBBI classic yearbook). The particular data series is for the total return on the S&P 500 index including dividends with all dividends reinvested.