
The long-term Performance of our Stock Picks has been excellent, even including the two market crashes of 2008 and of the early 2000’s.
Future Results Will Differ From Past Results.
Click to see complete details of our year-by-year performance back to year 2000 (our first full year) including graphs and details by individual stock, click the link here. Our detailed performance even shows the full results of the Editor’s personal portfolio!
These outstanding returns were achieved mostly in established profitable(and cash flow positive) companies – and not risky penny stocks.
Most of our stocks over the years would be considered value companies, or “growth-at-a-reasonable-price”. These have included financials (banks, property insurance, life insurance, wealth management and credit card companies), restaurants, retail, railroads, cable, telephone, breweries, property development, REITs, manufactures, trucking, package delivery, engineering services, software, preferred shares and more. Not all of these are on the list at any given time.
Click here, for sample Stock Rating Reports
We make no guarantees or predictions regarding future returns, but we hope to continue to beat the market indexes.
Click Subscribe now to learn about how you can access our current Stock Picks.
New visitors, be sure to join our free newsletter email list.
Below are graphs that illustrate our performance and the personal investment results of the editor of this site:
The following graph, shows (as of the end of 2025) the performance of our Stock Picks and of my own portfolio, and of the S&P 500 and the Toronto Stock Index since the end of 1999 when this Web Site started. The blue line is the average for stocks that we rated (lower) Buy or higher, the pink line is the performance of the personal portfolio of the editor/ owner of this Site, the black line is the Toronto stock index and the red line is the S&P 500.
This chart is accurate but it should be noted that it can be misleading. Due to the way compounding works, doing significantly better than the index in the early years becomes magnified as the years go on.
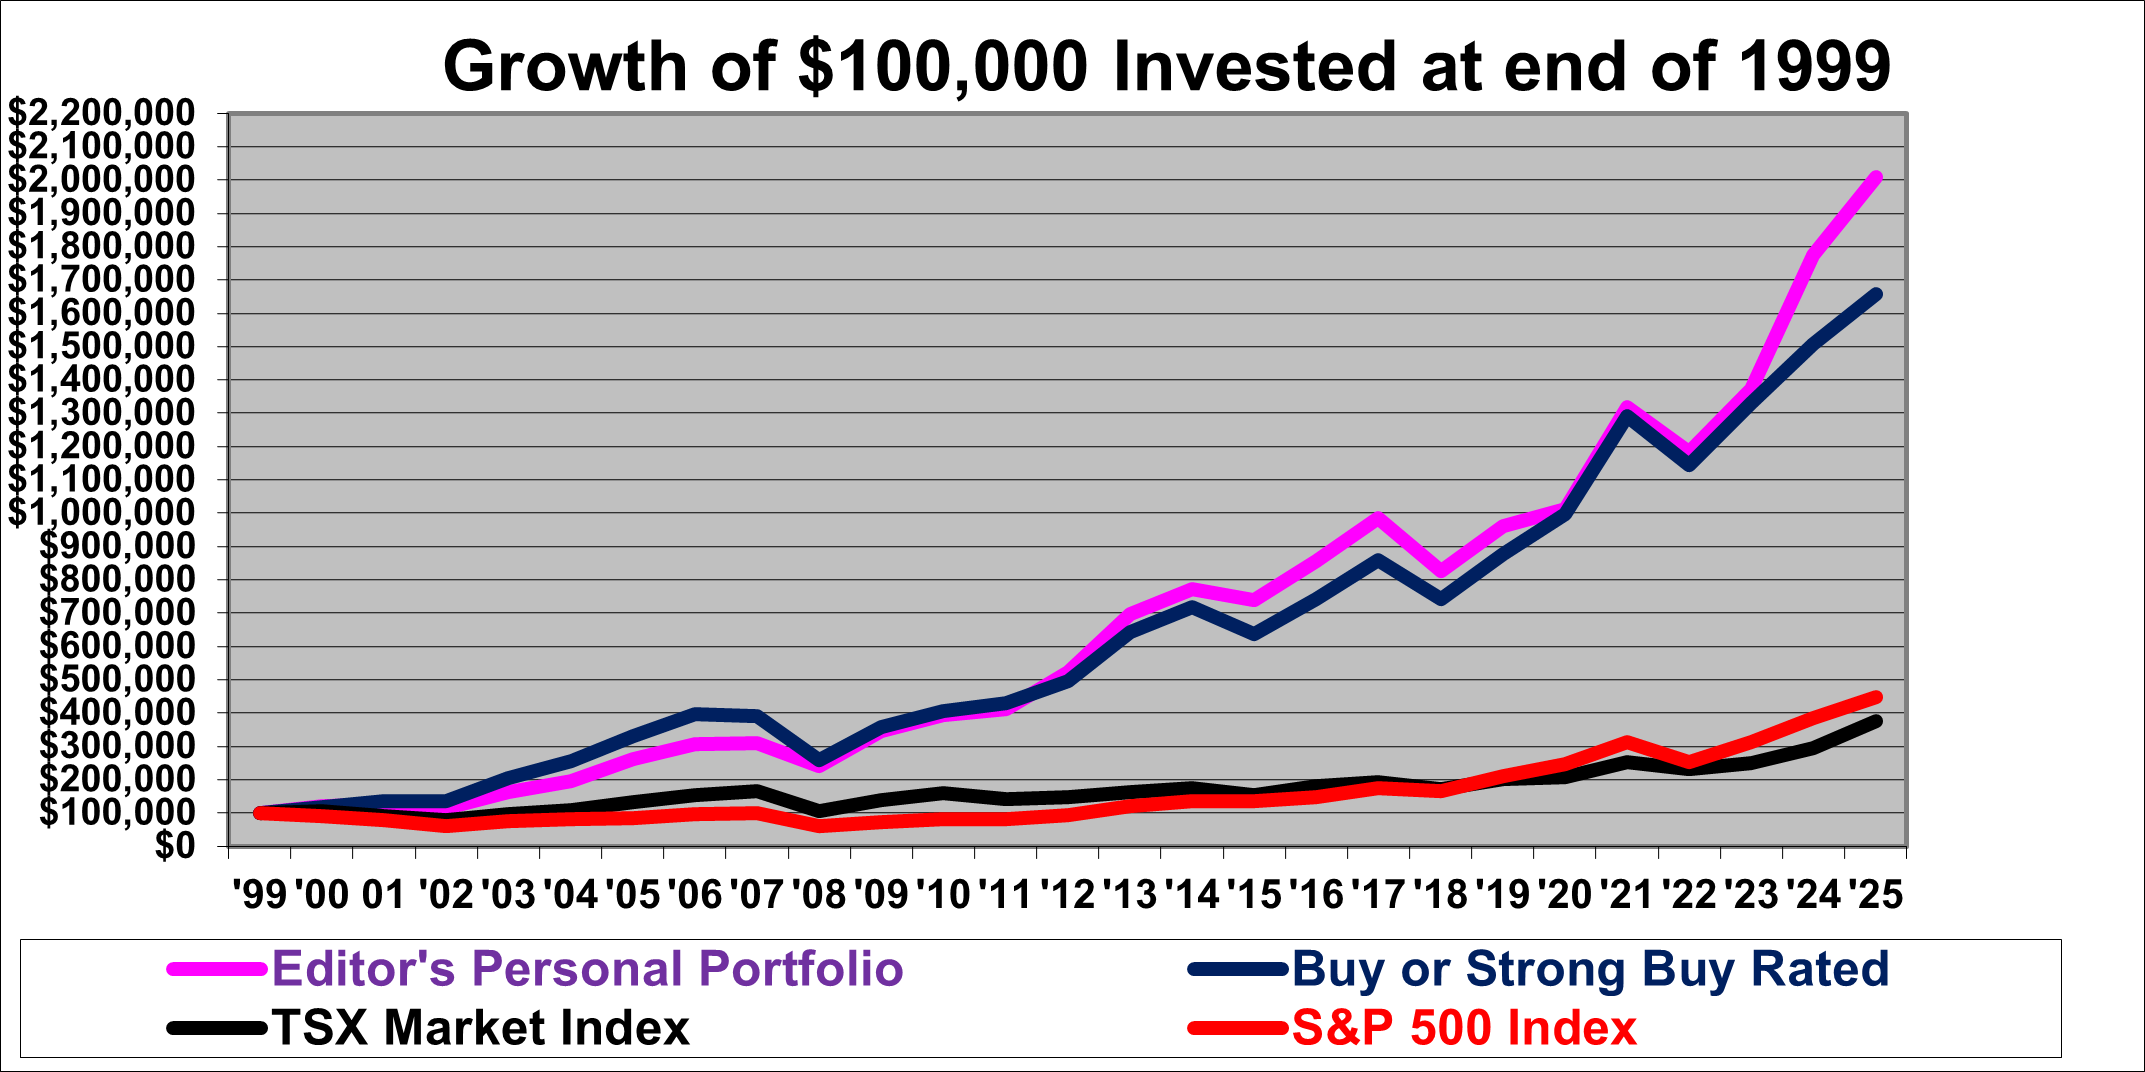
Dividends were not readily available to be included and are therefore excluded in the above graph, as they almost always are when stock indexes are discussed. (Except that the Editor’s personal portfolio line in the graph includes dividends, since that is how brokers report actual portfolios). Costs of trading are of course excluded in the table except again for the editor’s portfolio for which the performance is after all trading costs. The editor’s portfolio is also after the impact of changes in the U.S. dollar exchange rate while the Buy or Strong Buy line does not include changes in exchange rates.
There is, of course, absolutely no guarantee that these results will continue to apply in future.