
InvestorsFriend Inc. Newsletter November 17, 2012
Can You Get Rich Through Investing?
Today I address the somewhat politically incorrect topic of getting rich.
When it comes to investing, we all have different goals and we are all at different stages of life and have different income levels and different abilities to invest.
As one wag put it: “You’re unique… just like everybody else.”
lf even the possibility of getting rich by investing is not of interest to you, or not relevant to you or your children, or you think such a goal is immoral, feel free to to stop reading now. (I will pause briefly while you go away.)
Okay, for those of you interested, what is the evidence regarding the possibility of getting rich through investing? And how might you do it?
First I will look at the purely theoretical possibilities. Then I will look at actual return from stocks and bonds over long periods of times and then I will look at the results that I have actually achieved.
The purely theoretical possibilities of getting rich by investing money
The following table shows what happens to $1000 invested at various returns and for various periods of time.
| Return | 10 years | 20 years | 30 years | 40 years | 50 years |
| -2.0% | $817 | $668 | $545 | $446 | $364 |
| 0.0% | 1,000 | 1,000 | 1,000 | 1,000 | 1,000 |
| 2.0% | 1,219 | 1,486 | 1,811 | 2,208 | 2,692 |
| 4.0% | 1,480 | 2,191 | 3,243 | 4,801 | 7,107 |
| 6.0% | 1,791 | 3,207 | 5,743 | 10,286 | 18,420 |
| 8.0% | 2,159 | 4,661 | 10,063 | 21,725 | 46,902 |
| 10.0% | 2,594 | 6,727 | 17,449 | 45,259 | 117,391 |
| 12.0% | 3,106 | 9,646 | 29,960 | 93,051 | 289,002 |
| 14.0% | 3,707 | 13,743 | 50,950 | 188,884 | 700,233 |
The first row shows what happens to your $1000 if it loses 2% per year. This could occur with cash subjected to 2% inflation. It loses 2% in purchasing power per year. You can see that over the years the value of your $1000 subjected to a 2% annual loss (such as due to inflation) gets whittled away quite badly. So much for preservation of capital.
The 10 year column shows that your $1000 does not grow much in 10 years, unless, that is, you can achieve double digit returns. At 2%, it increases by only 22%. At 4%, it manages to grow by 48% in the ten years. However at 10% it grows by 159%. And at 14%, the money grows by 271%. It may not be that exciting to turn $1,000 into $3,707 in ten years. But the idea of turning your $10,000 into $37,070 in ten years or your $100,000 into $370,700 in ten years might be be at least mildly stimulating.
The 30-year column starts to get exciting even at much lower and more realistic returns. Even at 6%, your $1,000 grows by almost 500% to $5,743. At 8% your $1,000 grows 906% to $10,063 in 30 years. And it grow almost 5000% in 30 years at 14% to $50,950.
The 50-year column shows that even $1000 can grow to a substantial sum and will do so even at annual compounded returns of 6% or 8%. And the gain is truly staggering at 14%. And this can be after inflation if you wish since all the returns here are purely theoretical. (“All” you have to do is find the 6%, 8% or 14% returns and then wait the 50 years!)
But with rare exceptions, such as for an inheritance or trust fund, people don’t invest in the form of a one-time lump sum amount.
So what happens if you invest $500 per month ($6000 per year) at various theoretical returns for various long periods of time?
The following table shows what happens to your $6000 per year invested at various returns and for various periods of time.
| Return | 10 years | 20 years | 30 years | 40 years | 50 years |
| -2.0% | $54,878 | $99,718 | $136,355 | $166,290 | $190,749 |
| 0.0% | 60,000 | 120,000 | 180,000 | 240,000 | 300,000 |
| 2.0% | 65,698 | 145,784 | 243,408 | 362,412 | 507,476 |
| 4.0% | 72,037 | 178,668 | 336,510 | 570,153 | 916,003 |
| 6.0% | 79,085 | 220,714 | 474,349 | 928,572 | 1,742,015 |
| 8.0% | 86,919 | 274,572 | 679,699 | 1,554,339 | 3,442,621 |
| 10.0% | 95,625 | 343,650 | 986,964 | 2,655,555 | 6,983,451 |
| 12.0% | 105,292 | 432,315 | 1,447,996 | 4,602,549 | 14,400,109 |
| 14.0% | 116,024 | 546,150 | 2,140,721 | 8,052,151 | 29,967,128 |
After 10 years, $60,000 has been invested. At 8% this has grown to $86,919. And even if that is after inflation, this is not overly exciting. Even at 14% your money has not quite doubled. (But keep in mind it has only been invested an average of five years since it is invested at $6,000 per year).
After 30 years though things start to get interesting as the $180,000 invested will grow to $474,000 at 6%, $680,000 at 8% and over $2 million if you can achieve 14%.
After 40 years, $240,000 invested at $6,000 per year for the 40 years has grown to almost $1 million at 6%. This seems worthwhile.
After 50 years the results are quite motivating. The $300,000 invested over the 50 years grows to almost $1 million at 4% and to $3.4 million at 8% and a staggering $30 million if you could somehow achieve 14%.
I think the message from all of this is that in order to get rich through investing, three things are required. 1. Sufficient funds must be invested. 2. A decent return (or preferably an indecently large return) is needed, and 3. A lot of years are needed. Allowing money to compound for many years may be the most important requirement.
Has Stock and Bond Investing Historically Made People Rich?
In this section we replace the theoretical returns above with the actual historical total returns from the stock market and from long-term corporate bonds.
It may be argued that it would have been impossible to achieve these historic returns due to trading costs and income taxes. However we could assume that trading costs were paid from other funds and that the money was in a tax-sheltered account. Also trading fees are very low when exchange traded index funds are used (though those were not around years ago). Realistically the returns that we will show here are the maximums that could have been obtained from investing in stock and long-term corporate bond indexes.
I use calendar-year real dollar (after deducting inflation) total returns from a well-known reference book called “Stocks, Bonds, Bills and Inflation” 2012 edition. The book is published annually by Morningstar. (Ibbotson SBBI classic yearbook). The data begins with the returns for 1926. The data is for the total returns on the S&P 500 index and for U.S. Corporate bonds.
I will show what could have been achieved from investing in either 100% stocks (the S&P 500 index with dividends reinvested) or a balanced combination of 60% stocks, 35% long-term corporate bonds and 5% cash. To show this we will use a standard 30-year savings period and $6000 saved per year. Since we are using real data, the $6000 is also adjusted for inflation each year.
Using this data there are 57 historic different 30 calendar year periods that we can look at. The first period was 1926 through 1955, the second period was 1927 through 1956. The latest period available is 1982 through 2011.
Here is a graph of how an investment of $6000 per year invested in the stock market index (The S&P 500), and with dividends reinvested, would have grown over each of the 57 different 30-year historical periods. There is one line for each of the 57 different 30-year periods.
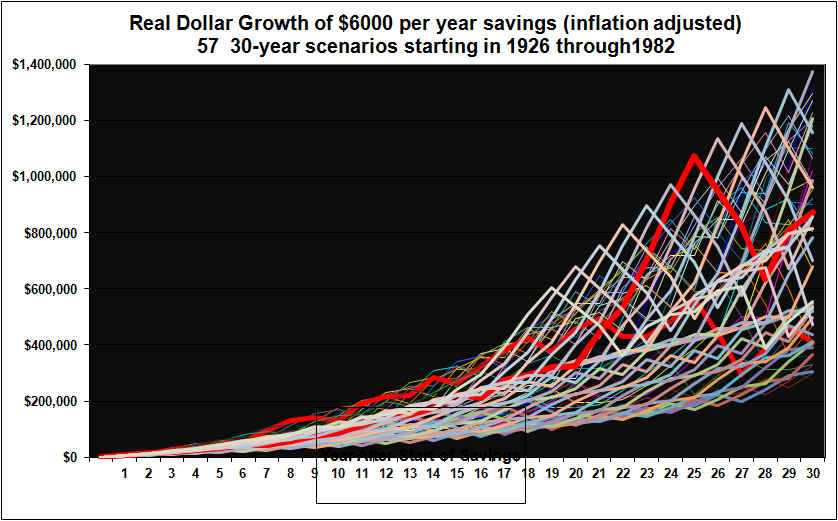
$6000 per year invested for 30 years amounts to $180,000. The ending values here, in real dollars, after deducting inflation, range from $277,471 all the way up to $1,374,265. This is a wide spread of results over the 57 different 30-year saving periods. The average is $754,511, but that may be cold comfort to those that were unlucky enough to have had 1952-1971 as their particular savings period and who ended up with just $277,471.
Note that there was huge stomach-churning volatility in the portfolio values for each of the 57 different periods. A few lines are marked in dark red to better illustrate the volatility. There was also volatility in the early years but it’s not visible due to the scale of the chart.
In order to lower volatility, it is often suggested that a balanced approach be used. Below we illustrate the results using an allocation of 60% stocks, 35% corporate bonds and 5% cash.
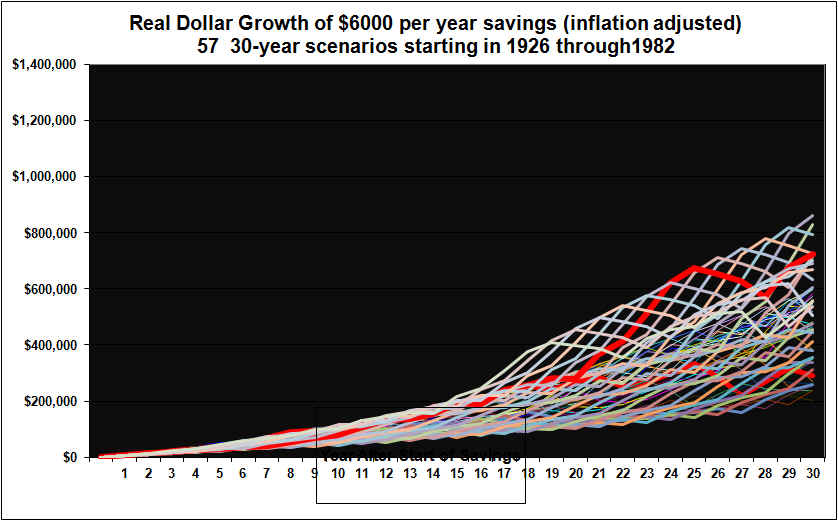
In this balanced portfolio case, the $180,000 invested over the 57 different 30 year periods grows to a final amount that ranges from $202,559 to $860,218. There is still a very wide range of results. Volatility is reduced but is still substantial.
From the graphs above, it is not possible to see when the best 30-year savings periods were and when the worse periods occurred. Nor is it possible to see above if there were any periods where a balanced portfolio beat out a 100% stock portfolio in terms of ending value. These questions are answered in the following graph.
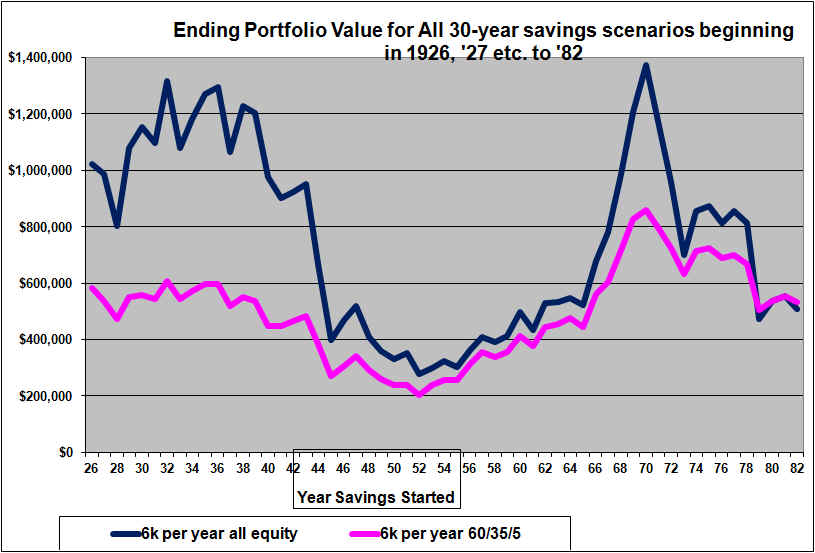
The graph above shows only the ending portfolio values after 30 years of saving $6000 per year. Again. this in in real inflation-adjusted dollars. The blue line shows the ending value for a 100% stocks approach, the pink line shows the ending value for the balanced (60% stocks, 35% long-term corporate bonds and 5% cash, rebalanced annually).
The leftmost points on the two lines show the results for the 30 years from 1926 through 1955. The (S&P 500) stock index investment grew to just over $1 million. The balanced portfolio grew to almost $600,000. Continuing across the graph, the rightmost points show the results from the most recently available 30-year period, being 1982 through 2011. The 100% stock approach grew to a little over $500,000 and the balanced approach was very similar and slightly higher.
Neither line on these graphs shows anything about the volatility of the portfolios over the 57 different 30 year savings periods (volatility was shown in the prior graph).
The graph above shows that over 30-year periods a 100% stock approach has almost always out-performed the balanced approach as of the end of the 30-year period. However, the out performance has, in all but a few cases, been modest for 30 year savings periods that started since about 1955. For the 30 year periods that started in 1926 through about 1942, stocks outperformed very significantly. (For 30 year savings periods that start in 2012, I am confident that stocks will outperform significantly. This is explained in our recent article).
Overall, the graph above would suggest that investing is not necessarily a sure path to getting rich. At least not by investing $500 per month for 30 years. It would appear that a higher investment and/ or a longer period of time might be needed.
Editor’s Experience At Getting Rich Through Stock Investing
My own experience is detailed on our performance page
My money has compounded at an average of over 11% since 1989. In the 10 years ending with 2012 (to date) my return has been 16% per year. The Stocks that achieved this and the rationale for selecting these stocks has been shared on this web site since mid 1999.
My best portfolio is one of my two RRSP portfolios. This RRSP account has had a total of $62,488 deposited to it over the years starting with an initial $2000 in 1991. The average time each dollar has been invested in this RRSP is under 12 years. Today this RRSP account sits at $442,751. Therefore each dollar originally invested has grown to $7.09. That is a septupling of money. This was not achieved by taking great risks. Most of the stocks in this portfolio over the years were mid to larger cap stocks that paid dividends. There were essentially no micro-cap stocks and very little to no resource stocks over all those years. his portfolio has lost money in only three of the 22 years it has existed. The biggest loss was 17% in 2008 when the TSX index lost 35%.
We know from the theoretical tables above that it is possible to get rich through investing within 30 years, if double digit returns can be achicved. I have achieved that and hope to continue to achieve that, or something close to it, by continuing the same methods that have worked well for me over the years.
In my experience then, you can indeed get rich through investing. But it takes a sacrifice, and it takes a long time. And it may require making above average returns. Our Stock Picks have achieved above average returns for our subscribers. Click here for information on subscribing, if you are not already a subscriber.
Testimonials
This Web Site has about 500 paying subscribers to our Stock Picks. I am gratified to have received many testimonials over the years. Apparently this site truly has been a friend to investors.
National Hockey League Business and the Strike / Lockout
I know a little bit about hockey and quite a bit about business. Here are some comments on this national hockey league strike lockout from a business perspective.
All power to the players if they can achieve over 50% of the revenues. In a free market economy we all have the right to charge what the market will bear.
The Players say they “gave-up” a lot in the negotiations the last time. That is one perspective. On the other hand the players certainly seem to have been paid well over those years so I can’t really agree that they “gave up” anything. I am sure they “got” as much as they could in the last negotiations.
The reason that NHL hockey can take in billions in revenue is obviously because fans pay the ticket prices and watch the games on television.
I don’t happen to believe that the fans pay and watch mostly because of the talents of today’s particular cohort of players and superstars. If fans watched sports primarily for the display of athletic skills then amateur sports would have more viewers.
Fans pay and watch because they have developed a large emotional connection to the outcome of the game. They frankly care a lot more who wins than they do about a graceful pass of the puck or a wonderful shot. Fans view the home-City team as “their” team. They almost feel a part of that team.
The emotional connection that fans have to the outcome of games and to their team winning the playoffs has been built up over decades. It includes inter-city rivalries. In includes memories and stories of games and series of many years ago. There is a brand value to NHL hockey that has been slowly built up over approximately 100 years.
The brand value of NHL hockey leads to the emotional attachment and the caring about the outcome that leads to viewers and big revenues. CBC’s hockey night in Canada was a HUGE part of building up that brand over the years. So was CBC radio in decades past. The entire minor hockey system with its hundreds of thousands of players and hundreds of thousands of volunteers and paying parents over the years has also contributed to building up the value of hockey as a sport and the brand value of the NHL. That includes all those towns that built hockey arenas over the years.
It is said that hockey is Canada’s game. Well, Canadians may not be able to claim ownership over the NHL, but they can claim to have paid for much of its value.
The players and especially the super-stars of the past contributed greatly to the value of NHL hockey that exists today.
Today’s players also contribute to the value. But mostly all they have to do is maintain they value. They certainly don’t have to grow it from scratch.
Today’s players are largely temporary contributors to and beneficiaries of the value of NHL hockey. A few of the superstars will contribute to the value in a way that will live on for decades, but the mast majority are temporary occupants of their jersey’s (their numbers will not be retired).
The brand value of the NHL is mostly an intangible thing. It does not legally belong to anyone. But the tams and the league largely control the brand value.
The teams and the league can continue to exist indefinitely. The players come and go. The players can play largely because of the existence of the teams and not the other way around. Sure the teams need players but willing hockey players number in the many thousands, while the teams number just 32 and there is but one national hockey league. In my opinion the players, given this situation, already get an astoundingly large share of the revenue.
The CBC created much of the value but has no ongoing ownership in it aside from whatever value there is in the Hockey Night in Canada brand. I suspect fans would still watch the games if the CTV out-bid the CBC for those games.
It’s a strange union when players bargain both collectively and individually.
It’s a strange manner of competition when we have 32 teams competing against each other but also in many ways cooperating with each other. There may be 32 teams but there is only one league. Each team may want to be as rich and as strong as possible. But the league knows that in order to maximise revenues no one team can be allowed to get too dominant. People will not pay top dollar to watch a foregone conclusion.
Today’s crop of players and the teams and league will jockey for the best outcome they can get from the other side. Both will do some damage to to the brand this year. Both will give up substantial revenue that is currently not being generated. Fans, affected employees of arenas, restaurants and Hotels and the CBC all stand by, interested in the outcome but with no voice. However if these groups feel sufficiently abused and disillusioned it will show up in lower ticket sales and lower brand value. Both the players and the owners should keep that in mind.
Neither the players nor the owners are required to listen to the views of fans. They can and will do what they think is best for their own self interests. In that respect hockey is like any other aspect of the free market. It is not a perfect system, but it is better than any alternative system. And things will work themselves out. And hockey will resume. The money at stake will automatically insure that this happens (eventually).
P.S. If you get REALLY rich through investing you can buy your own NHL team and then help to insure that future strikes are avoided.
Subscribe
If you are looking for stocks to invest in then you can subscribe now. The cost is just CAN $13 per month or $120 per year. When you think about the potential returns from just one well-researched Stock Pick, you can see why our subscription service has been a great investment for our subscribers.
END
Shawn Allen, President
InvestorsFriend Inc.
To see older editions of this newsletter, or to get off of this email list , click here.