Valeant Pharmaceuticals International, Inc.
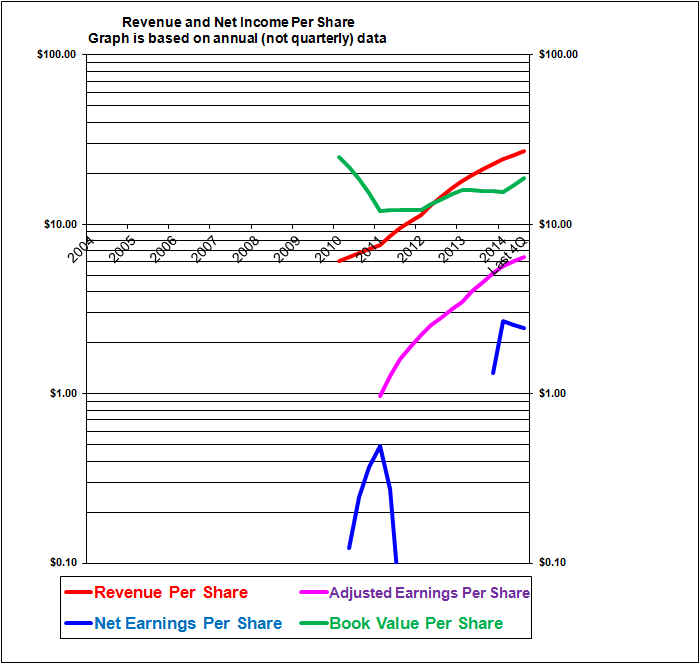
The chart here only starts in 2011. Although Valeant existed as Biovale prior to that, it effectively became a new company in the September 2010 when it came under new management merged with a company called Valeant and changed its name and also paid out a special dividend. Revenues per share have grown at a compounded rate of 47% annually in 2012 through 2014. Adjusted earnings (the pink line) grew at a compounded annual rate of 81%. The fact that GAAP earnings (the blue line) are always substantially below the adjusted earnings line and is absent (negative) in 2013 illustrates the fact that there are substantial adjustments to arrive at adjusted earnings. That makes the adjusted earnings less reliable as one can argue about the validity of the various adjustments.
| Valeant Pharmaceuticals International, Inc. (VRX, Toronto and U.S.) | |
| RESEARCH SUMMARY | |
| Report Author(s): | InvestorsFriend Inc. Analyst(s) |
| Author(s)’ disclosure of share ownership: | The Author(s) hold no shares |
| Based on financials from: | Dec ’14 Y.E. +Q2 ’15 |
| Last updated: | 30-Jul-15 |
| Share Price At Date of Last Update: | $253.91 |
| Currency: | $ U.S. |
| Generic Rating (This rating does not consider the circumstances of any individual investor and is therefore not specific advice for any individual): | Sell at $253.91 |
| SUMMARY AND RATING: The graph of revenues per share (red line) shows exceptional growth since new management took over and the company was effectively reborn through a significant merger in 2010. The adjusted earnings per share have also grown at an exceptionally strong rate in that period. The book value per share would have grown at a high rate if not for amortization and other expenses that have been added back in adjusted earnings. The Value ratios would indicate no better than a Hold rating given the strong growth but tempered considerably by the very high P/E ratio. Management quality appears strong but we are concerned about the trust factor given the apparently aggressive approach to adding back items in calculating their cash EPS figure and also given what appears to be aggressive measures to avoid income tax. The insider trading signal is moderately positive. Executive compensation seems excessive. The outlook for earnings growth seems good but may not justify the high P/E ratio. The economics of the business are strong in that it has patent and brand protection. We are concerned by the very high debt level which results in high interest rates on debt and a BB minus debt rating. We are perplexed as to how it was able to borrow so much money. Overall we would rate this as a Sell. | |
| DESCRIPTION OF BUSINESS: (Based on the 2014 annual report) Valeant is a large international pharmaceutical company that has recently grown at a rapid rate through acquisitions. Although headquartered in Canada, Valeant obtains 97% of its revenue outside Canada. While this company is Canadian in form it appears to be a U.S. company in substance. Valeant’s equity market value is U.S. $88 billion dollars (making it Canada’s highest valued company, the enterprise value after adding debt is U.S. $119 billion. On its balance sheet the total assets are U.S. $48 billion with equity of U.S. $6.6 billion and debt of U.S. $31 billion. As of early 2015, the company had 17,000 employees. 800 in R&D, 6200 in sales and marketing and 1600 in general and administrative and 8200 in production. An international drug and medical device developer, manufacturer and marketer. Its products include prescription drugs and over-the-counter (non-prescription) products. It markets directly or indirectly in over 100 companies. In developed countries it focuses on eye, skin and brain products. In non-developed countries it focuses on branded generic drugs, over-the-counter products and medical devices. Overall revenues are 43% from prescription drugs, 21% from over-the-counter products, 20% from medical devices, 15% from branded and other generics (drugs?) and 2% from other. The company relies on selling brand names rather than on patent protection. It focuses on products that are paid for directly by the user or the user’s drug plan rather than on products that government is paying for. It attempts to focus on products with large growth potential. Its R&D (800 employees) is focused on delivering new products through clinical trials as opposed to basic research. It attempts to focus on products that are easier to manufacture. The product portfolio consists of about 1600 products. Some of the major products for developed countries are Acne products (Solodyn . Rentin-A and others) Wellbutrin (for depression), various eye-care products, contact lenses, surgically implanted lenses, and skin tightening products. In addition the company has lists four generic products. In Emerging Market countries the products are mainly branded drugs and over the counter products and medical devices. Products include eye care, respiratory care, contact lenses, surgically implanted lenses and skin tightening products. Revenues are heavily concentrated in the U.S. at 54% of revenue. The next there important countries are Canada at 5%, Poland 3% and Russia 3%. Overall revenues are 75% from developed countries and 25% from emerging markets. Its largest two customers (presumably distributors) accounted for 17% and 10% of revenue. It has 40 manufacturing plants world-wide. In addition, some manufacturing is subcontracted. Half of its revenues come from products manufactured by others under ‘toll” agreements. The company lists about 251 subsidiaries in various countries. | |
| ECONOMICS OF THE BUSINESS: The economics of the drug and over-the-counter treatment business appear to be good in that there are tariff and brand protections. On an adjusted earnings basis, Valeant’s profit is 24% of revenue. In part, this high profit ratio is achieved by virtue of a very low tax rate. This is then leveraged down to a 4.6% return on assets as revenues are only 19% as large as the asset figure. This however, is leveraged back up to a 34.5% return on ending equity as ending equity is a slim 13.3% of assets. The leverage to equity is provided mainly by debt but also to some extent by deferred income taxes. The equity may be considered to be somewhat artificially lowered by the expensing of deferred taxes that may never be paid and by the expensing of the amortization of intangibles. | |
| RISKS: These risks are as to the earnings of the company, not the stock price which faces all of these risks plus the risk that the stock price is currently over-valued. A number of its products face generic competition. The company did not indicate the percentage of its revenues involved. The company is inherently subject to product litigation and liability issues. They are not insured against this but rather they self-insure. There are risks due to government regulatory actions. | |
| INSIDER TRADING / INSIDER HOLDING: Checking insider trading from January 1, 2015 to July 25, 2015: About four insiders had sold shares after exercising options. Sales prices were mostly $200 to $222 U.S. dollars. Two directors bought 500 shares each at about U.S. $200 to $230. One director also apparently bought 500 shares for a family member at U.S. $230. A senior officer bough 7500 shares at U.S. $235. Overall and given that selling on option exercise is to be expected the insider trading signal can be considered moderately positive. In terms of insider ownership, a good number of executives and directors own substantial shares. Directors and executives as a group own 8.62%. | |
| WARREN BUFFETT’s CRITERIA: Buffett indicates that all investments must pass four key tests: the business is simple to understand and predict (marginal pass at best due to complexity of regulations and R&D efforts), has favorable long-term economics due to cost advantages or superior brand power (pass due to patents and brands), apparently able and trustworthy management (marginal pass at best as we have some concerns about the cash EPS figure), a sensible price – below its intrinsic value (fail due to high P/E), Other criteria that have been attributed to Buffett include: a low debt ratio (fail due to very high debt ratio), good recent profit history (pass using adjusted earnings) little chance of permanent loss of the investors capital (marginal pass at best as the high leverage combined with product liabilities could cause a wipeout) a low level of maintenance type capital spending required to maintain existing operations excluding growth (pass) | |
| MOST RECENT EARNINGS AND SALES TREND: | |
| COMPARABLE STORE SALES: Not applicable. The company did discuss organic growth versus acquisition but we did not see a clear disclosure of this on a percentage basis. | |
| Earnings Growth Scenario and Justifiable P/E: The adjusted P/E is high at somewhere between 22 and 40 depending on how one calculates adjusted earnings. It takes considerable growth to justify this level of P/E. | |
| VALUE RATIOS: The price to book value ratio is ostensibly very unattractively high at 13.6 particularly considering that the company’s assets are mostly intangibles. A very high P/B ratio can sometimes be justified but it requires a very high ROE to justify this P/B level. The price to book ratio would be more reasonable but still quite high at 7.5 if we added back the accumulated amortization of intangibles. And it might be reasonable to add back some of the deferred income taxes as well and perhaps some of Valeant’s other add-backs to income which would further lower the P/B ratio. There is no dividend. The P/E ratio using our more conservative view of adjusted earnings is unattractively high at 40. Using management’s view of 2015 expected so-called cash EPS the P/E is still somewhat high at 22. The ROE using our view of adjusted earnings is very strong at 37%, however, this is significantly overstated since equity has been reduced by amortization charges and restructuring charges that are added back for adjusted earnings (and would not have reduced equity if they were not expensed). Also it is achieved partly through high debt leverage. Growth in revenue per share in the past three calendar/fiscal years has been extremely strong at a compounded annual 47% and in adjusted earnings per share at 81%. Estimated present value per share: We estimate the intrinsic value per share at U.S. $141 if adjusted earnings per share grow for 5 years at the more conservative rate of 15% and the shares can then be sold at a P/E of 15 and $232 if adjusted earnings per share grow at the more optimistic rate of 20% for 5 years and the shares can then be sold at a P/E of 20.Both estimates use a 6.5% required rate of return. Keep in mind that these figures are highly dependent on the way that adjusted earnings are calculated as will as on the growth and P/E assumptions as well as the required return. Overall these value ratios suggest no better than a hold rating given the high growth but also given that it is effectively pricing in continued growth in the area of 20% annually. | |
| SUPPORTING RESEARCH AND ANALYSIS | |
| Symbol and Exchange: | VRX, Toronto and U.S. |
| Currency: | $ Canadian |
| Contact: | ir@valeant.com |
| Web-site: | www.valeant.com |
| INCOME AND PRICE / EARNINGS RATIO ANALYSIS | |
| Latest four quarters annual sales $ millions: | $9,259.5 |
| Latest four quarters annual earnings $ millions: | $831.0 |
| P/E ratio based on latest four quarters earnings: | 104.7 |
| Latest four quarters annual earnings, adjusted, $ millions: | $2,188.7 |
| BASIS OR SOURCE OF ADJUSTED EARNINGS: Rather than use management’s figure, which seems aggressive to us, we have added back 75% of the amortization of intangibles and 75% of restructuring and integration costs and items management identified as other income or gains (the 75% assumes that these expenses reduced income tax at a 25% rate on average). In Q2 2015 we added back 75% of the large expense of accelerated stock options since that appeared to be a cost of an acquisition. | |
| Quality of Earnings Measurement and Persistence: In 2014 the major components of expense were cost of goods sold at 27% of revenue, selling, general and admin at 25%, amortization and impairment of intangibles at 19%, and interest at 12%. | |
| P/E ratio based on latest four quarters earnings, adjusted | 39.8 |
| Latest fiscal year annual earnings: | $913.5 |
| P/E ratio based on latest fiscal year earnings: | 95.3 |
| Fiscal earnings adjusted: | $1,941.8 |
| P/E ratio for fiscal earnings adjusted: | 44.8 |
| Latest four quarters profit as percent of sales | 23.6% |
| Dividend Yield: | 0.0% |
| Price / Sales Ratio | 9.40 |
| BALANCE SHEET ITEMS | |
| Price to (diluted) book value ratio: | 13.59 |
| Balance Sheet: (last updated for Q2, 2015) Assets consist of 2% cash, 11% other current assets (receivables, inventory, pre-paid and deferred tax assets) 3% property and equipment 36% goodwill and 48% intangible assets (which are very similar to goodwill as they consist largely of the purchased value of brands and product rights). These assets are supported on the liability and equity side of the balance sheet as follows: 1% accounts payable (which suggests that the company to a very large degree generates its products in house with few outside inputs) 6% accrued and other liabilities, 1% acquisition contingent consideration, 64% debt, 13% deferred income tax liabilities and 14% common equity. This appears to be a very weak balance sheet given the high level if debt and considering that the assets are largely purchased goodwill and equivalent. Most of the deferred tax liabilities arose in acquisitions. | |
| Quality of Net Assets (Book Equity Value) Measurement: This is irrelevant since the stock is trading at 14 times book value. Clearly the book equity is worth far more than its stated value however it is not at all clear that it is worth 14 times. In any case the company is clearly valued for its earnings and not its book assets. | |
| Number of Diluted common shares in millions: | 344.4 |
| Controlling Shareholder: There is no controlling shareholder as such but there are several large owners. Based on the 2015 management proxy circular; The Ruane, Cuniff & Goldfarb fund owns 10.2%, Perching Capital (Bill Ackman) owns 5.8%, Value Act Capital (owned by management) owns 5.6% and T. Rowe Price owns 5.3%. | |
| Market Equity Capitalization (Value) $ millions: | $87,446.6 |
| Percentage of assets supported by common equity: (remainder is debt or other liabilities) | 13.3% |
| Interest-bearing debt as a percentage of common equity | 480% |
| Current assets / current liabilities: | 1.5 |
| Liquidity and capital structure: The balance sheet is weak due to a heavy debt load. The credit rating is weak at BB minus from Standard and poors which is several notches below investment grade. | |
| RETURN ON EQUITY AND ON MARKET VALUE | |
| Latest four quarters adjusted (if applicable) net income return on average equity: | 37.4% |
| Latest fiscal year adjusted (if applicable) net income return on average equity: | 37.2% |
| Adjusted (if applicable) latest four quarters return on market capitalization: | 2.5% |
| GROWTH RATIOS, OUTLOOK and CALCULATED INTRINSIC VALUE PER SHARE | |
| 3 years compounded growth in sales/share | 47.4% |
| Volatility of sales growth per share: | $ – |
| 3 Years compounded growth in earnings/share | 76.2% |
| 3 years compounded growth in adjusted earnings per share | 80.6% |
| Volatility of earnings growth: | $ – |
| Projected current year earnings $millions: | $4,012.3 |
| Management projected price to earnings ratio: | 21.8 |
| Over the last five years, has this been a truly excellent company exhibiting strong and steady growth in revenues per share and in earnings per share? | Yes |
| Expected growth in EPS based on adjusted fiscal Return on equity times percent of earnings retained: | 37.2% |
| More conservative estimate of compounded growth in earnings per share over the forecast period: | 15.0% |
| More optimistic estimate of compounded growth in earnings per share over the forecast period: | 20.0% |
| OUTLOOK FOR BUSINESS: The company lists a number of products in development. The company indicates that it has additional cost synergies that it will achieve. The company also continues to make acquisitions. Given the high debt levels its pace of acquisitions will likely have to slow. | |
| LONG TERM PREDICTABILITY: It is difficult to predict given the recent sharp growth by acquisition. | |
| Estimated present value per share: We calculate U.S. $143 if adjusted earnings per share grow for 5 years at the more conservative rate of 15% and the shares can then be sold at a P/E of 15 and $235 if adjusted earnings per share grow at the more optimistic rate of 15% for 5 years and the shares can then be sold at a P/E of 20. Both estimates use a 6.5% required rate of return. | |
| ADDITIONAL COMMENTS | |
| INDUSTRY ATTRACTIVENESS: (These comments reflect the industry and the company’s particular incumbent position within that industry segment.) Michael Porter of Harvard argues that an attractive industry is one where firms are somewhat protected from competition based on the following four tests. Barriers to entry (pass). No issues with powerful suppliers (pass although there are some sole-sourced input products). No issues with dependence on powerful customers (marginal pass as the top three customers account for over 30% of revenues), No potential for substitute products (pass) No tendency to compete ruinously on price (pass). Overall this industry appears to be attractive for an established incumbent. | |
| COMPETITIVE ADVANTAGE: Valeant indicates that it has lower selling, general and admin costs and that its decentralized structure is an advantage. However, it faces a disadvantage in the high interest rates that it is paying on its very high debt load. Their access to Wall Street investment banks for borrowing may be an advantage. | |
| COMPETITIVE POSITION: We are not aware of where it stands in the industry although it does appear to be large. | |
| RECENT EVENTS: In July 2015 announces a pending acquisition valued at U.S. $0.8 billion. In April 2015, acquired Salix Pharmaceuticals, a leader in gastrointestinal products at an enterprise value of U.S. $14.5 billion financed primarily with debt but it also issued $1.45 billion in shares at a price of U.S. $199. In 2013 the company became a B.C. registered company and stopped being a federally registered company. In seeking shareholder approval for this the company noted that the BC system was more modern and more flexible in regards to corporate transactions (mergers and acquisitions, and divestitures) and in particular did not require 25% of the directors to be Canadian. In 2014 acquired several businesses at a cost of $1.4 billion. In 2013 acquired Bausch and Lomb in a major transaction valued at U.S. $8.7 billion. Several other businesses were acquired in 2013 for a total of $0.9 billion. In 2012 acquired the shares of Medicis for $2.6 billion. Subsequent to certain relatively recent acquisitions the company undertook workforce reductions and closed duplicative facilities (R&D, sales offices and corporate locations). In 2014 divested certain product rights for $1.4 billion | |
| ACCOUNTING AND DISCLOSURE ISSUES: The company’s view of “cash earnings per share” as a form of adjusted earnings per share appears to be aggressive and to over-state earnings. In summary they appear to add back all non-cash expenses. Primarily this is stock compensation which they apparently are suggesting is not a “real” expense. Amortization of debt issue costs is added back presumably because it is non-cash, even though this is normally considered to be a deferred interest expense. Premiums paid to retire debt early were added back, perhaps on the basis that this is a one-time cost. Amortization of intangibles is by far the largest item added back and we would agree with this as long as the intangibles are likely to have indefinite lives which is likely for brand names but may or may not be the case for product rights. We would also reduce the add-back by a tax impact but it’s not cleat that Valeant has done so or, if they have it appears they used a very low tax rate. The other add backs appear to be added back on the basis that they should be treated as part of the capital cost of an acquisition, this includes accelerated stock options, and certain inventory costs, and acquisition-related contingent consideration and restructuring and integration costs (the basis of this last may be that it is in the nature of a one-time cost). These add-backs may be reasonable but we would be reluctant to add back all of these and again it did not appear that much of a tax impact was accounted for (these items were mostly deductible for tax purposes and if they were not expenses then the tax benefit would not be present). Overall, we are concerned that that the extent of these add-backs is too aggressive. Also we did not see an explanation for why each items was added back. In our own view of adjusted earnings we took a somewhat more conservative approach adding back 75% of amortization and restructuring charges and unusual gains or losses or other income gains and well as the accelerated stock option expense. The 75% assumes a 25% tax rate which is higher than they actually face. The company self-insures for product liability but it is not clear than any expense has been accrued for this. | |
| COMMON SHARE STRUCTURE USED: Normal, one vote per share. | |
| MANAGEMENT QUALITY: Overall, the quality of management appears to be good given the performance. However we do have deep concerns about the aggressiveness of the calculation of so-called “cash EPS” and also about the apparent aggressive measures to reduce income tax including use of subsidiaries in Luxemburg. The company indicates that it measures success through total shareholder returns but does focus on a three year period. In our view that is a dangerous goal as it can lead to management taking actions that push up the share price beyond a reasonable level however, the focus on a three year period does mitigate our concern. The company indicates that executives were required to purchase several; million dollars worth so shares with their own money and that several went beyond the required level. This is a positive indication. The decision to self-insure against product liability may expose the company to unnecessary risk. | |
| Capital Allocation Skills: The market has judged Valeant’s capital allocation skills to be exceedingly good. The share price has climbed over 600% mostly due to acquisitions. In terms of share buybacks Valeant did not buy back any shares in 2014 as the price rise and in 2013 had not bought at prices higher than U.S. $91. However in 2015 the company has bought back some shares at U.S. $223. We would question the wisdom of that purchase. | |
| EXECUTIVE COMPENSATION: We would describe executive compensation as being obese. In 2014, compensation for the five named officers ranged from US. $10 million to U.S. $51 million. Strangely, the CEO was the lowest among the five. Given the market valuation, the compensation is not the biggest concern but we do take it as a negative indicator. | |
| BOARD OF DIRECTORS: Warren Buffett has suggested that ideal Board members be owner-oriented, business-savvy, interested and financially independent. The Valeant Board has 11 members. Two are from the investment capital industry (one of whom owns over 5% of the company. There are several with management consulting experience including pharmaceutical consulting experience, several pharmaceutical industry executives , two with CFO experience, and one with investment banking experience. The CEO is also chair of the Board. Overall it appears to be a good Board. | |
| Basis and Limitations of Analysis: The following applies to all the companies rated. Conclusions are based largely on achieved earnings, balance sheet strength, earnings growth trend and industry attractiveness. We undertake a relatively detailed analysis of the published financial statements including growth per share trends and our general view of the industry attractiveness and the company’s growth prospects. Despite this diligence our analysis is subject to limitations including the following examples. We have not met with management or discussed the long term earnings growth prospects with management. We have not reviewed all press releases. We typically have no special expertise or knowledge of the industry. | |
| DISCLAIMER: All stock ratings presented are “generic” in nature and do not take into account the unique circumstances and risk tolerance and risk capacity of any individual. The information presented is not a recommendation for any individual to buy or sell any security. The authors are not registered investment advisors and the information presented is not to be considered investment advice to any individual. The reader should consult a registered investment advisor or registered dealer prior to making any investment decision. For ease of writing style the newsletter and articles are often written in the first person. But, legally speaking, all information and opinions are provided by InvestorsFriend Inc. and not by the authors as individuals. The author(s) of this report may have a position, as disclosed in each report. The authors’ positions may subsequently change without notice. | |
| © Copyright: InvestorsFriend Inc. 1999 – 2015 All rights to format and content are reserved. | |