
InvestorsFriend Newsletter December 29, 2012
What’s Your Million Dollar Strategy?
It was in 1998 that I read a little book called Michael Decter’s Million Dollar Strategy. Michael Decter had started with $50,000 in RRSP savings at the start of 1987 and set a goal of accumulating a million dollars. By the end of of 1996, Michael Decter had contributed a further $62,000 in savings for a total of $112,000. By astute investing in stocks, in his RRSP account, he had turned this $112,000 into $1.3 million dollars. Then he wrote a book about it. By 1998 when the book came out his portfolio had grown to $1.5 million.
Michael Decter’s book explained how he analyzed individual companies by reading their annual reports. Michael Decter’s large gains were partly due to some very good luck when some very large bets on a few companies paid off really big time. (One of his large investments gained 399% and made him $507,000). But it seemed clear that he was onto something. Having invested $20 in his book I decided to give his methods a try. At 38 years of age at that time and with a good job I knew I had the time to eventually accumulate a orthwhile portfolio.
Michael Decter’s Million Dollar Strategy became a catalyst for my own Million Dollar Strategy.
So far, it has worked out pretty well. At the start of 1998, our two RRSPs totaled $74,049 consisting of $43,440 in original contributions and $30,609 in gains. In the 15 years since then then we have contributed a further $88,239. The two RRSPs are now worth a combined $830,336 consisting of $131,679 in contributions and $698,657 in gains. 2012 has been an excellent year with a 28% gain. The gain alone in 2012, $180,082, is significantly larger than the total contributions that were made over a period of 23 years. That is what compound returns can do for you when applied over a long period of time.
So what should your own strategy be? Can investing in stocks work for you like it has for me and for Michael Decter? Everyone’s starting portfolio is different. And people have different amounts that they can save. And some of you are already drawing down savings rather than adding to them.
But can stock investing work for you? If you are younger can you have your own Million Dollar Strategy? If you are investing in stocks perhaps our Stock Picks service can help you. Basically, you can look over my shoulder and know the stocks that I am already invested in and investing new money in and exactly why. And, at your own risk, you may decide to invest in some of the same stocks.
A Dangerous and False “Observation”
Those who don’t like and don’t trust the stock market are often very fond of asserting that “No one has made money in stocks since the year 2000”. Taken literally, this is clearly false since even in a falling market there are always some people making money.
It is true that the U.S. stock index (the S&P 500) is still down about 8% since the start of the year 2000. If we added in dividends it would be up slightly. But after investment fees it would likely be down. And so it is true that on average a pot of money invested in U.S. stocks at the start of the year 2000 has not grown. But most investors add new money each year.
The following chart shows how $10,000 per year invested in the markets has grown.
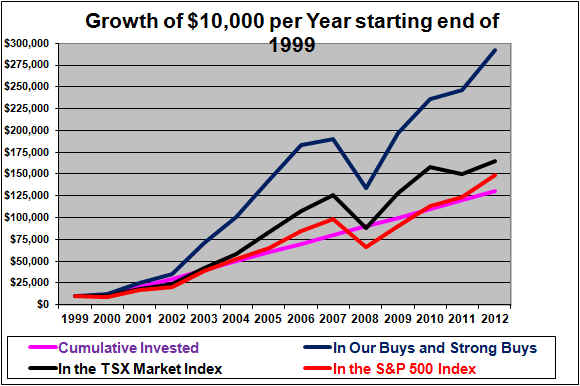
$10,000 per year invested since the start of the year 2000, is a total investment of $130,000. If the money earned nothing each year it would now total $130,000. If it was invested in the S&P 500 index it would have grown to $149,061 (and that excludes dividends). That ‘s not a lot of growth but it does put the lie to the assertion that the average investor in stocks has made nothing since the year 2000. If the $10,000 per year was invested in the TSX index it has grown to $164,359. And if it was invested equally at the start of each year in the Buys and Strong Buys here at InvestorsFriend.com, it would have grown to $292,253.
An interesting thing about the graph here is that while it shows a very large decline from the end of 2007 to the end of 2008, there is little sign of the big market plunges in 2000, 2001, and 2002. The reason for that is that this is showing a cumulative portfolio that started out at $10,000 in 2000 and with $10,000 added each year. When the S&P fell 10% in 2000 and 13% in 2001 and 23% in 2002, the portfolio was still growing due to the $10,000 per year new investments.
In any event even if stocks have, on average, provided poor returns in the past 13 years that in no way implies that the returns going forward will be poor. In fact, all else equal, we should expect the opposite. A series of below average years in stock markets tends to be followed by above average years.
A True But Dangerous Observation.
Those who don’t like and don’t trust the stock market are also often very fond of pointing out that over the past one, five, ten or even twenty years, an investment in government bonds has beaten the return on stocks. That is a true observation. But it is a dangerous and in fact deeply mis-guided observation if it is meant to imply that bonds are are likely to do better than stocks in the next ten or twenty years.
The reason for this was explained in detail in our article regarding the attractiveness of stocks versus bonds in 2012.
Back in 1979, Warren Buffett compared the returns on Stocks versus Bonds and observed that stocks were earning an average of about a 13% ROE, and could be purchased at around book value, and 20-year government bonds were yielding 9.5% and he said:
Can better results be obtained over, say, 20 years from a group of 9 1/2% bonds of leading American companies maturing in 1999 than from a group of Dow-type equities purchased, in aggregate, at around book value and likely to earn, in aggregate, around 13% on that book value? The probabilities seem exceptionally low.
And what happened? Well a 20-year zero coupon government bond would have earned 9.5% per year if bought in 1979 and held until 1999. The S&P 500 meanwhile earned a compounded 18% over the next 20 years as stocks continued to earn at least a 13% ROE (on average) and as the multiple of the price to book value rose with the very strong stock market of the 1990’s. Score one for Buffett.
But, more recently bonds have indeed beaten stocks. Let’s look at the situation at the end of 1981. By then 20-year government bonds were yielding 13.34%. Stocks had risen 50% since the start of 1979 and therefore could no longer be purchased at book value. At that point bonds may have looked more attractive than stocks.
And consider the end of 1999. 20-year government bonds were yielding 6.82%. Stocks meanwhile had an average P/E of about 30 which equates to an earnings yield of 3.3%. In 1999 Buffett wrote an article in which he calculated that stocks might be expected to earn about 7% (6% after investment costs) over the next seventeen years. On that basis, I don’t think Buffett will have been too surprised that it turned out that bonds purchased in 1999 have (so far) beaten stocks purchased that year.
And what would Buffett’s 1979 observations suggest for today? 20-year Government bonds are yielding 2.5%. The average stock in the Dow Jones Industrial Average has a P/E of 14.85. That’s an earnings yield of 6.7%. Now, 6.7% may not be a great return, but it easily beats the 2.5% from long-term government bonds. And if some of the earnings are retained and earn high ROEs are earned by companies then the return from stocks will be higher than 6.7%. On this basis, Stocks are clearly a better buy than long-term government bonds as of today.
So, the observation that bonds have beaten stocks over the past one, five, ten and twenty years is correct but very dangerous if used to justify favoring bonds over stocks at this time.
Warren Buffett has recently suggested that stocks are about the best investment at this time. I certainly agree with that.
END
Shawn Allen
President, InvestorsFriend Inc.