
HISTORICAL REAL RETURNS IN THE MARKET STOCKS vs. LONG GOVERNMENT
BONDS vs. T-BILLS
Update in Progress
What returns, after deducting inflation, have investors actually made over various holding periods such as 30 years, or ten years? This article shows those returns for stocks (based on the S&P 500 index), bonds (based on 20-year U.S treasury bonds and cash (30-day Treasury bills). We also show the data for balanced portfolios holding a combinations of stocks, bonds and cash. Was the best approach to go 100% stocks or to use a balanced approach?
This is all U.S. data. The data used here was purchased but similar data for Canada or other counties is not readily available even for purchase.
The results here are for one-time investments at the start of 30, 15 or 10 year holding periods. We have other articles that explore the results from making equal annual investments.
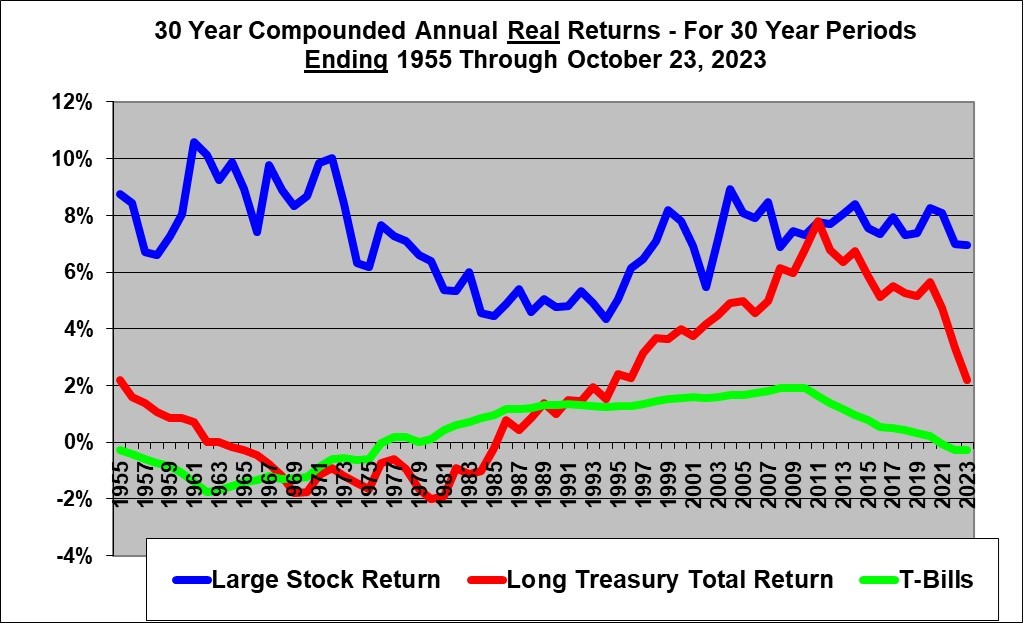
The above graph needs a bit of explaining. Each point on the above graph shows the compounded annual real return (after deducting inflation) from holding each asset class for 30 year periods ended at the end of the year shown on the “X” axis.
For example, the leftmost points on the blue (stocks) line indicates that the average compounded return from holding stocks (the S&P 500 index stocks) for the 30 year period started January 1,1926 and ending December 31, 1955 was about 8.5% while the red (bonds) line shows that holding the U.S. twenty year treasury bond (and selling the bond at the end of each year to purchase the latest 20 year bond to maintain a constant maturity of 20 years) earned about a compounded 2.1% and holding 30-day treasury bills for that 30 year period earned just less than 0.0%. In all cases the returns are after deducting inflation, omit taxes, omit trading costs and assume reinvestment of all dividend and interest income.
Stock (S&P 500 total return index) real returns for 30-year holding periods ranged from a compounded return of a minimum 4.4% per year (which turns a dollar into $3.64 after inflation) to a maximum compounded return of 10.6% (which turs a dolalr into $20.53), with an average of 7.2% ($8.05) across the 69 different 30-year holding periods. These are attractive returns. A 7.2% real return compounded for 30 years increases purchasing power by eight times.
XXX
T-Bills which are supposed to be safe are almost a guarantee that your return will at best barely outpace inflation in the long run. Treasury Bills always returned less than a compounded 2% (after inflation) over the 67 different 30 year periods, and often returned less than 0.0% as T-Bills failed to even compensate for inflation. The real T-Bill return for the 67 different 30-year investment periods ranged from minus 1.8% compounded to positive 1.9% with an average of 0.4%. A 0.4% real return compounded for 30 years increases purchasing power by only 13%.
20-year Treasury Bond real returns for 30-year holding periods ranged from a compounded return of minus 2.0% per year to a maximum compounded return of 7.8%, with an average of 1.9% across the 67 different 30-year holding periods.
Treasury bonds have provided unusually high compound average real returns over 4% in the 30-year periods that ended after 2000. These were for time periods that started from 1970 to 1992 and held for 30 years. This was mostly due to the high interest rates that prevailed in the late 1970’s and the 1980’s and also partly due to the huge drop in interest rates over those 30 year periods which provided capital gains in addition to the interest income.
The above graph shows that for the 67 different 30 calendar year rolling investment periods ranging from 1926 through 1955, all the way to 1992 – 2021, real (after inflation) stock returns were higher at the end of 30-year holding periods than 20-year government bonds (Except for the 30 year period started in 1982 and ending 2011 where it was a virtual tie with bonds edging out stocks). In most of the 30-year periods, stock returns were very significantly higher.
Note that the one time that bond returns matched the stock returns, the stocks actually still had a very good return for the 30 years. The bond return was unusually high for the years ending around 2011 because bond interest rates were high at the start of those periods and fell over the periods providing strong interest income as well as capital gains.
Note that stock portfolios that were set up in 1928, just before the massive stock crash of 1929 – 1932, and ending in 1957, still beat bonds – and by a huge amount. And these are for one-time investments at the start of the 30-year period.
Shorter time periods
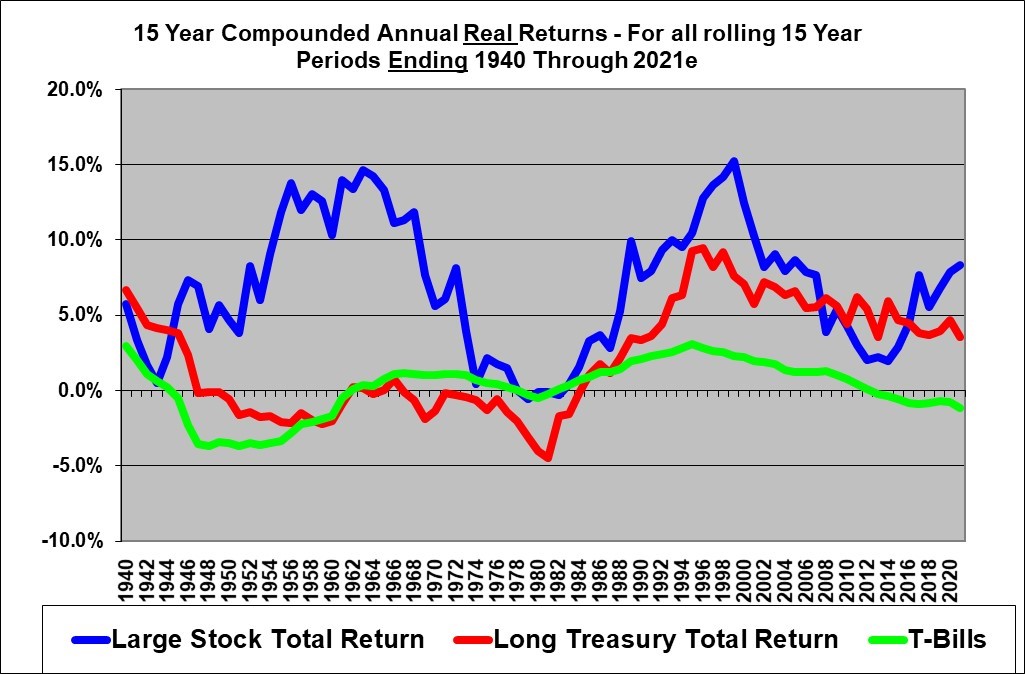
Stocks held for the 82 different 15 calendar year holding periods mostly did very well with a maximum compounded real return of 15.3% and an average of 6.9%. But it may be sobering to see that there were occasions where stocks (the S&P 500) gave no return over a 15 year period. The lowest return was minus 0.6% for the 15 years ending December 31, 1979. In fact stocks performed so poorly over the 1970’s that Business Week magazine famously declared the Death of Equities as inflation was destroying the stock market. That proved to be spectacularly wrong after the FED managed to slay inflation through the early 1980’s by choking the economy with massively high interest rates.
The 20-year bond index (the red line) over the 82 rolling 15 year holding periods performed quite poorly over all the periods ending from about 1946 to 1987. But then bonds performed strongly for all the 15 year periods ending after 1987. The highest compounded return was a real return of 9.4% for the 15 years ended December 31, 1996. With this divergent track record it is somewhat meaningless to look at the average. Twenty year U.S. treasury bonds currently yield less than 2% and likely nothing after inflation.
For 15-year holding periods there are a few periods where bonds beat out stocks. Stock portfolios began in the late 20’s (and ending 1940 to 1944) or that began at the end of 1993 through the year 2000 (and ending 2008 to 2016) did not out-perform long-term government Bonds over the next 15 years.
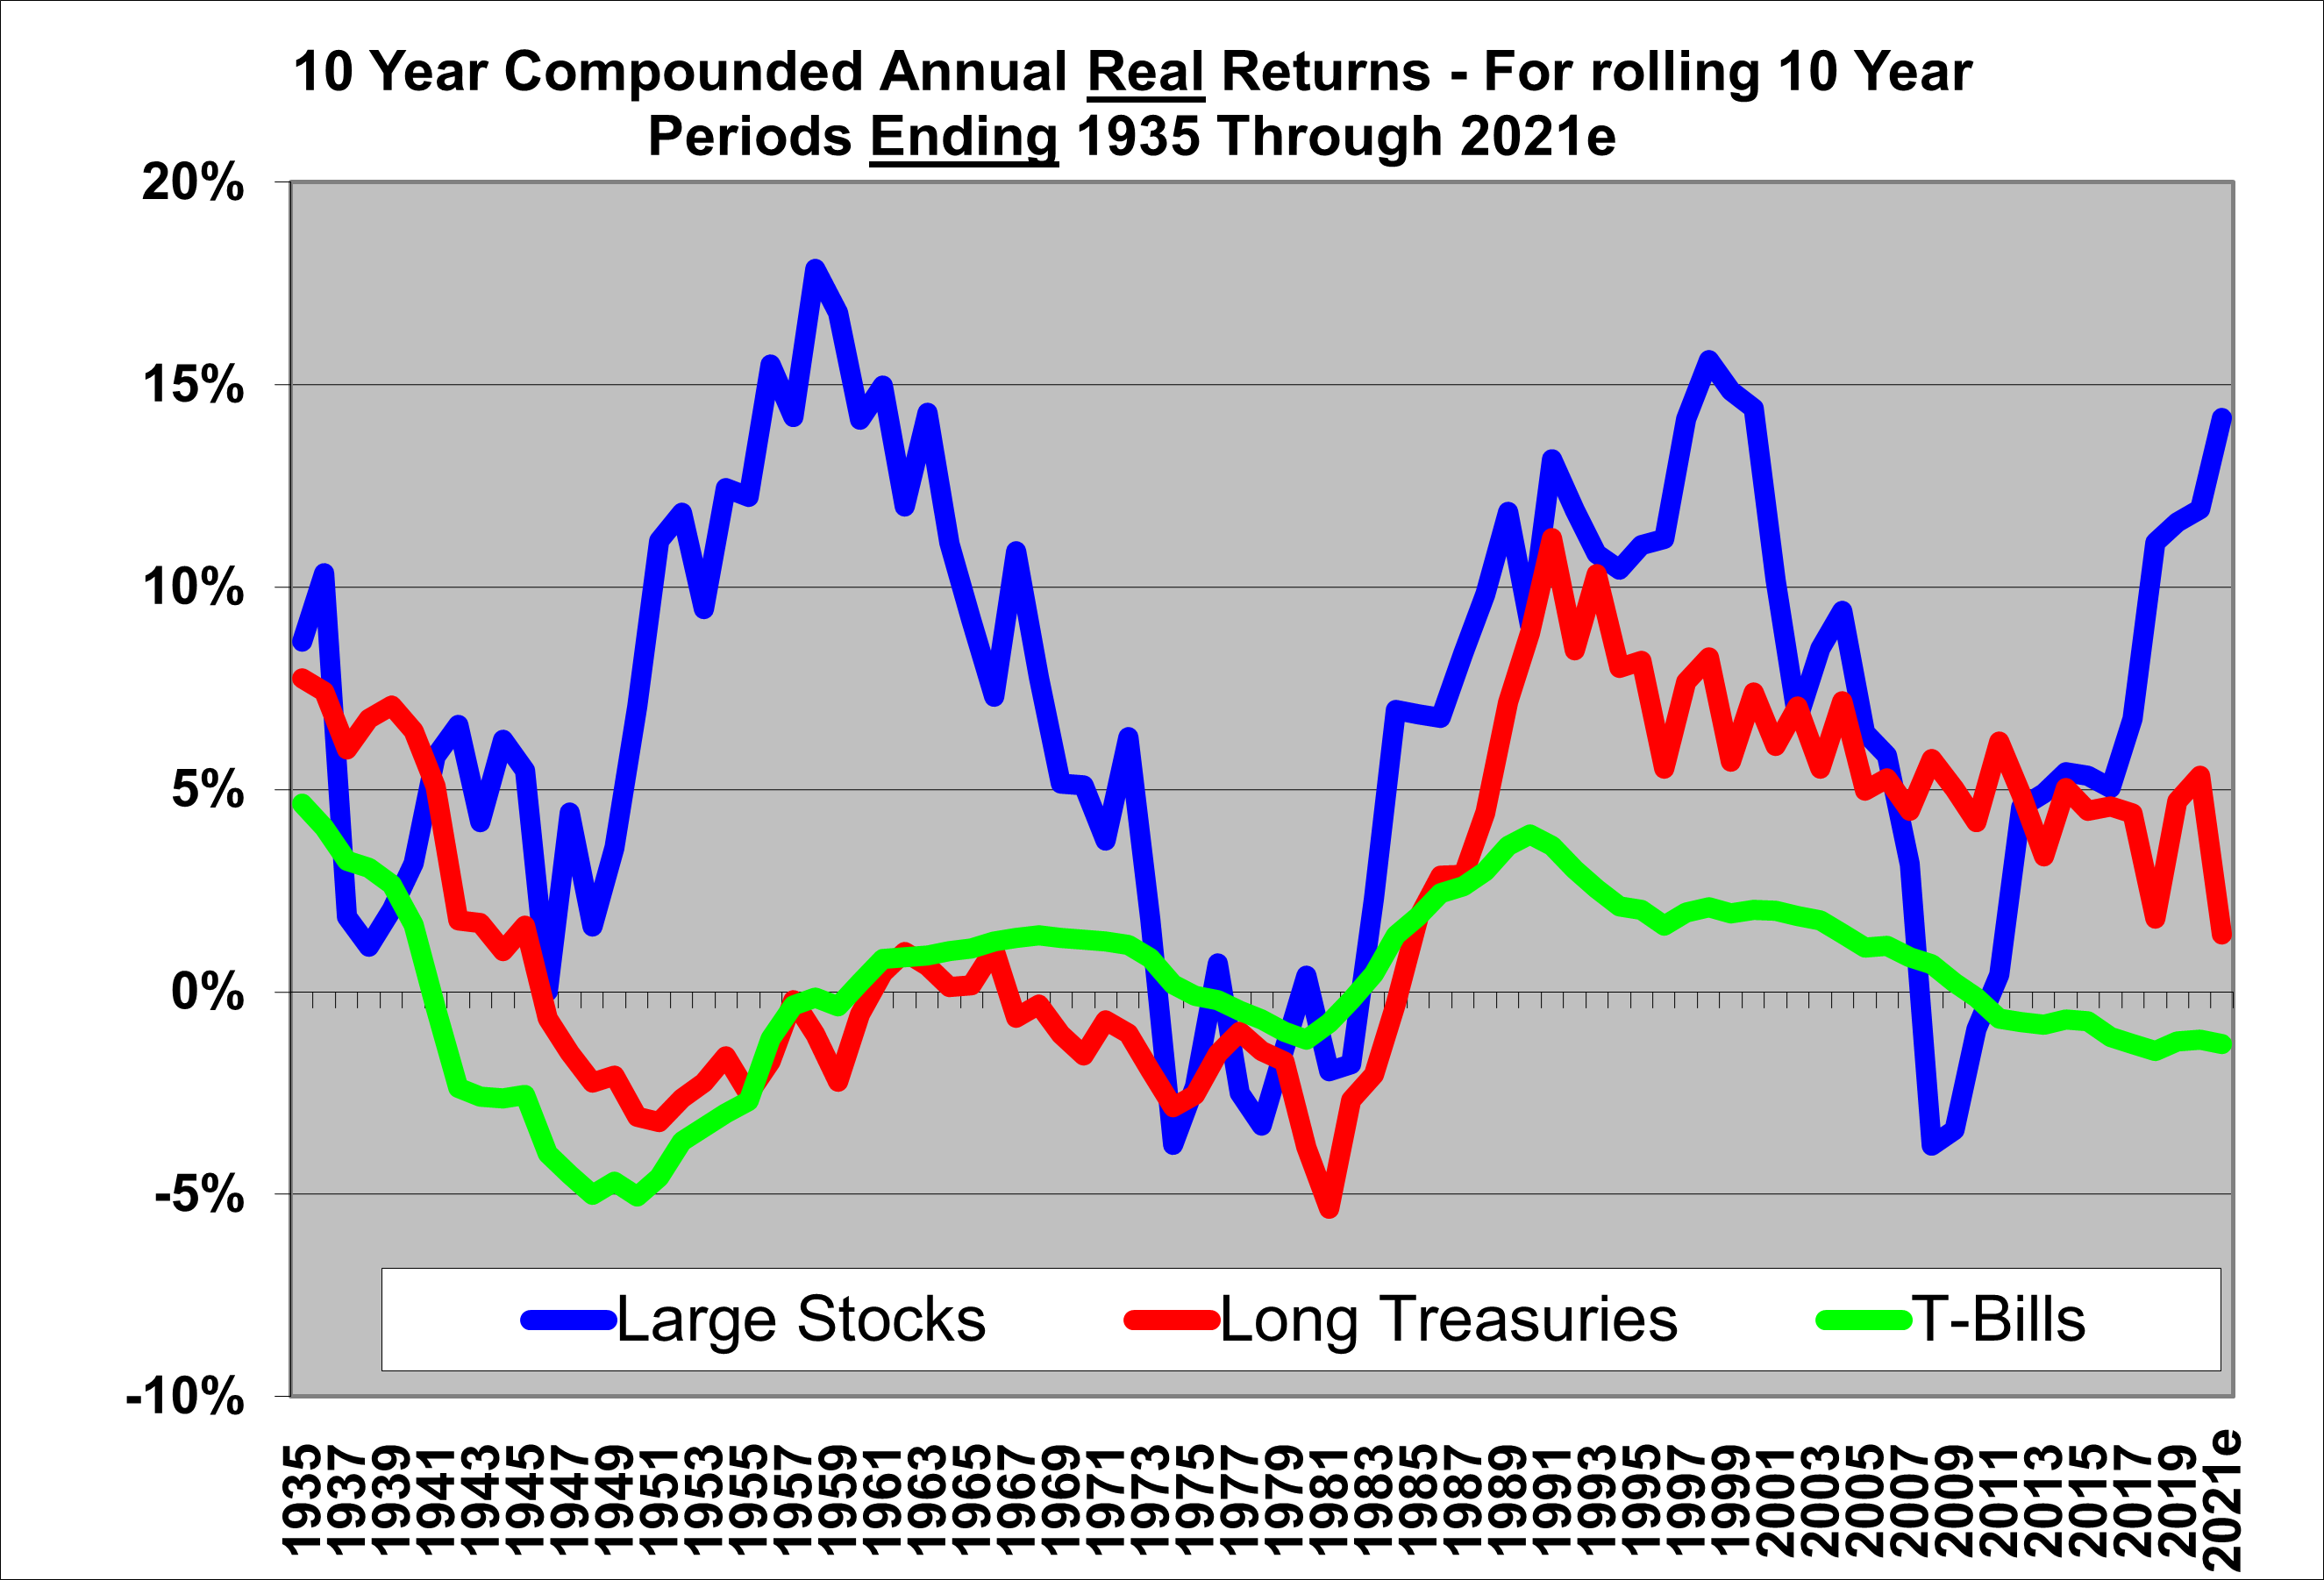
For 10-year holding periods there are still not very many periods where bonds beat out stocks. However, we do see that in the five 10-year periods ending 2008 through 2012, bonds did beat stocks by a significant amount. The range of real, after inflation, bond returns was relatively large from minus 5% compounded for ten years to over 10% compounded per year. It is apparent that the average return from stocks over many of the 10-year holding periods was significantly higher than the return from bonds. Interestingly, the worst case scenario for stocks was not quite as bad as the worst bond scenario.
Balanced Portfolios
Most investment advice advocates holding a balanced portfolio of stocks, bonds and cash. It is sometimes claimed that due to dollar cost averaging balanced portfolios can provide both higher returns and lower risks. So let’s take a look at the average returns over 30-year periods using balanced portfolios.
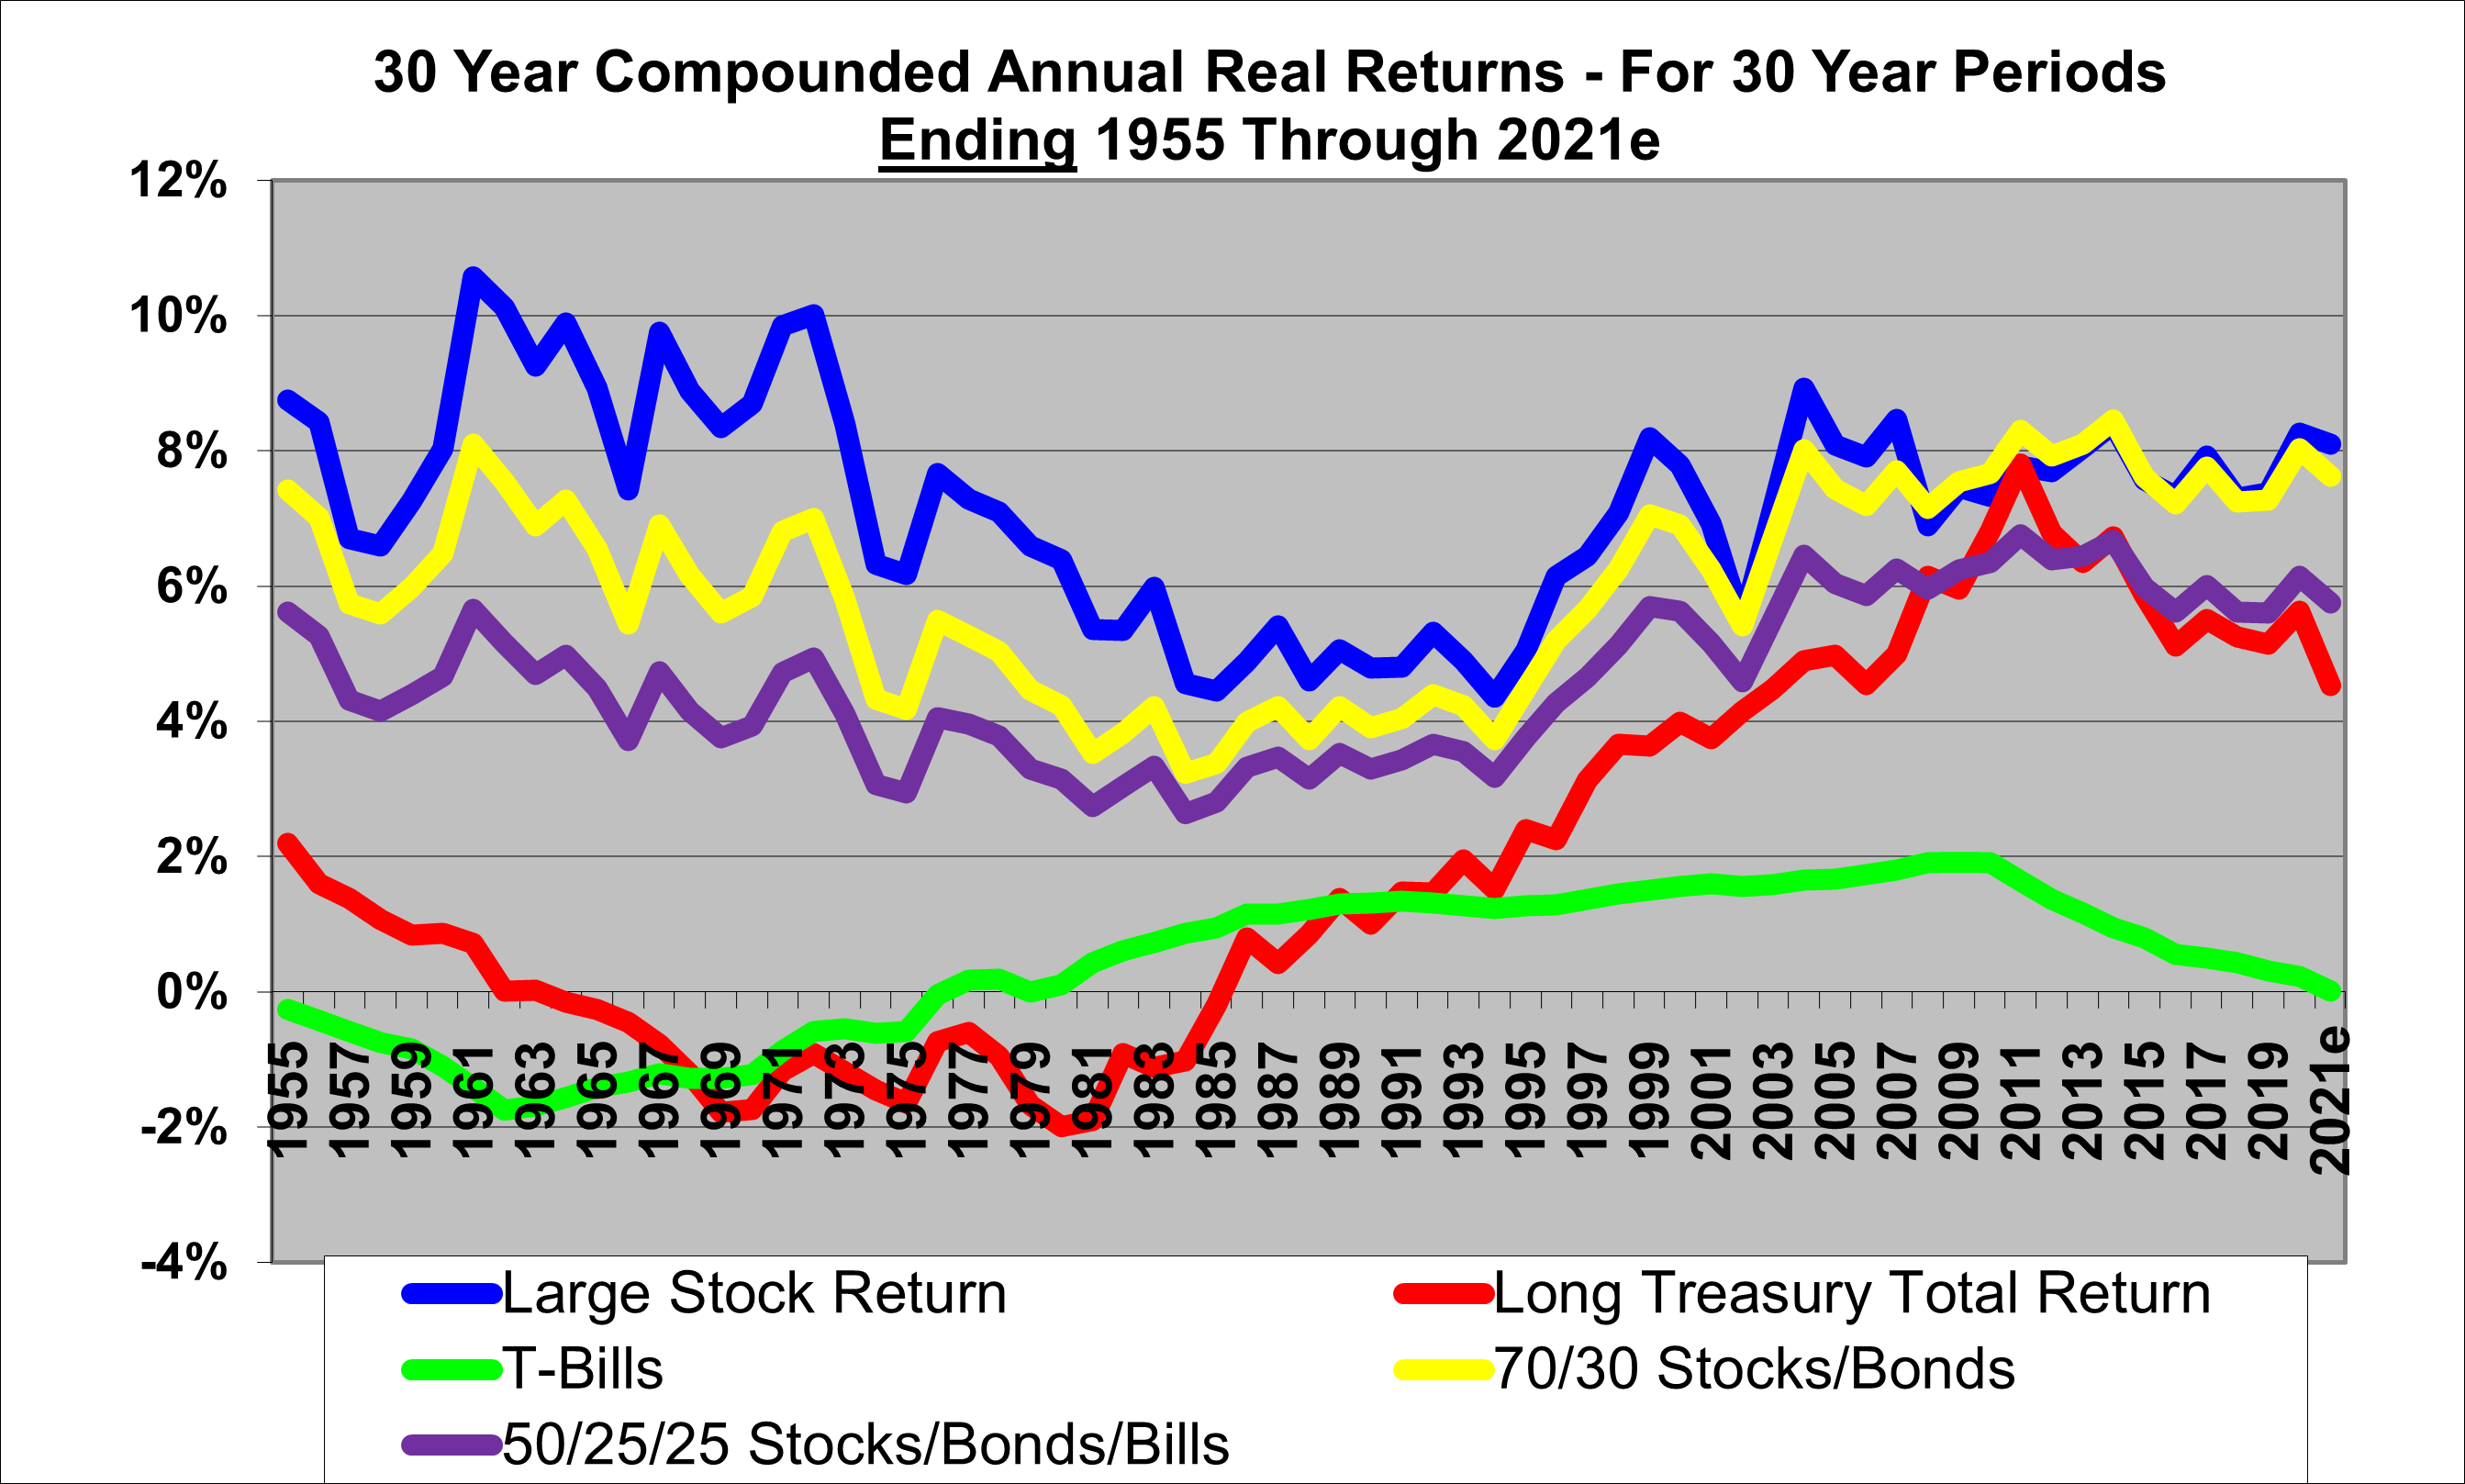
The above graph illustrates that over the 67 rolling 30 year periods ending in 1955 through 2021, Balanced portfolios noticeably under-performed 100% stock portfolios in the earlier decades. However for time periods ended in recent decades, the balanced 70% stocks / 30% bonds portfolio (the yellow line) often marginally beat the 100% stock portfolio and never lagged stocks by much.
One thing that stands out here is that holding a constant 25% cash in a balanced portfolio (the purple line) is detrimental. It never beats the 70/30 stocks/bonds portfolio.
The strong performance of the balanced approach in the more recent 30-year holding periods leads many to conclude that this result is to be expected in future. That’s probably not so. Balanced portfolios nearly kept pace with (or even beat) stocks in more recent 30 year periods because of high interest rates in the early years of those periods and becasue of the dramatic drop in interest rates that provided capital gains. Now that interest rates are at historic lows, that situation will almost certainly not occur for 30 year periods that are starting now.
Proponents of Balanced Portfolios often argue that you will only give up a small amount of return and will get lower annual volatility. But note that a $100,000 stock portfolio growing at say 8% (after inflation) grows to $1,006,300 in 30 years, while a Balanced portfolio growing at say 6.0% grows to only $574,300. So, the stock portfolio in this case is worth a hefty 75% more. So much for giving up a “small” amount of return!
Balanced approaches, however may be advantageous for shorter periods, as the following illustrates.
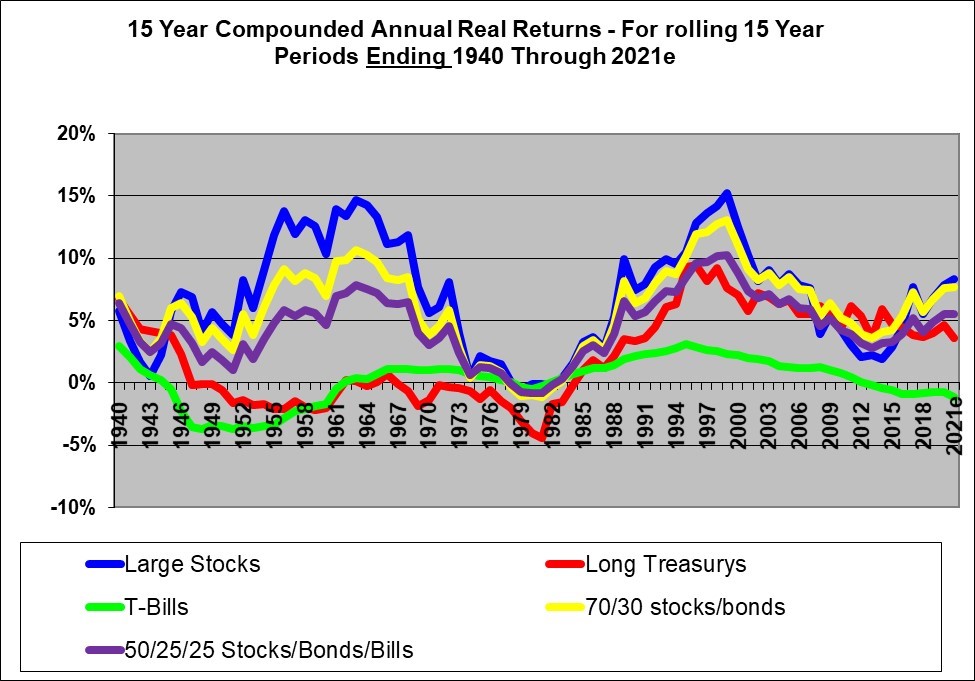
The above graph illustrates exactly what would have happened to an investor following a partly balanced approach of 70% stocks and 30% bonds (the yellow line) or following a more fully balanced 50%, 25%, 25% stocks, bonds and cash (bills) allocation (the purple line). This assumes U.S. data and that stocks are represented by the S&P 500 index stocks, bonds by 20-year U.S. government bonds and cash by 30-day U.S. government Treasury bill investments. This assumes annual re-balancing to maintain the balanced allocation and to maintain the 20-year maturity of the bonds. There is no speculation in this data, only historical reality. Note though that this is for a one-time investment at the start of each 15 year period.
The result is that the partially balanced portfolio significantly under-performs a 100% stock portfolio in many of the 82 different rolling 15 year periods. The partially balanced approach was superior only for 17 periods which were those that that started in 1926 through 1931 and ending in 1940 through 1945 and as well in the 15 year periods ended 2002 and in 2007 through 2016 and the period ended 2018 (so a lot of recent periods). And the yellow 70/30 portfolio does not trail the 100% stocks portfolio by very much most of the time.
One thing that the graph illustrates is that for 15 year holding periods, all of the asset classes gave poor real returns for the 15 year periods ending approximately 1975 through 1986. And being balanced among three poorly performing asset classes was of no help.
Overall, the graph above provides good support for the notion that a balanced portfolio such as 70% stocks, 30% bonds is a good approach for investment periods of around 15 years.
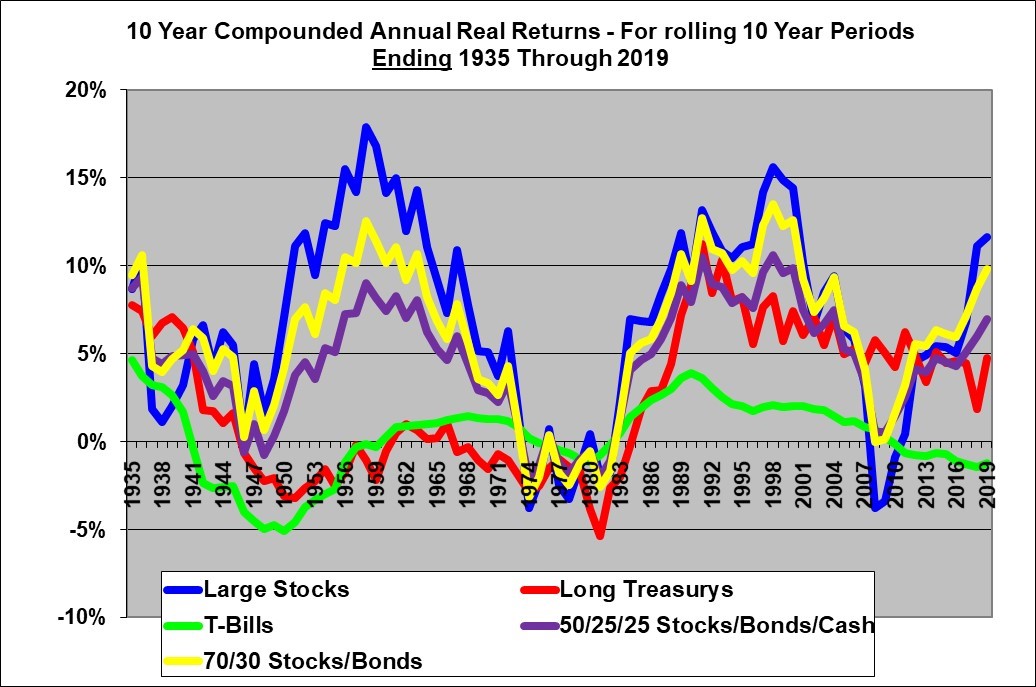
The balanced 70% stocks / 30% bonds portfolio sometimes outperforms the 100% stocks approach over these ten year holding periods – especially in the more recent periods. And it rarely trails the 100% stocks approach by much. The 50% Stocks, 25% bonds, 25% cash portfolio appears to consistently under perform the 70% stocks approach. It would be reasonable to conclude from this graph that the 70% stocks approach is a good approach compared to 100% stocks for ten year holding periods.
Summary
In regards to stocks, this discussion deals only with the performance of the large stocks comprising the S&P 500 index as a group it does not deal with the risks of investing in a non-diversified portfolio of stocks.
For shorter-term investments the stock market is very risky compared to Bonds and short term treasury Bills. The average return from stocks has been consistently higher over long periods but over shorter periods (anything under 10 to 15 years) the results from stocks are hugely uncertain. It would be most unwise indeed to invest money needed next month or next year or even prior to about 10 to 15 years in 100% stocks
As the time horizon lengthens, we reach a point where stock returns are almost (but never quite) certain to exceed Bond and Bill returns – at least based on historical calendar year U.S. results from 1926 through 2021. For time horizons exceeding 15 years it seems quite unlikely that stocks will under perform Bonds and virtually certain that they will out perform Bills. With a 30 year time horizon it seems virtually certain (based on history) that stocks will outperform Bonds. A 100% (diversified) stock portfolio seems virtually certain to outperform, over 30 year periods, portfolios with any portion of the funds allocated to Bonds or Cash. And the case for stocks is all the stronger if you consider that people don’t typically invest a single lump sum for 30 years. Rather they invest on an annual basis which greatly reduces the exposure if one is unlucky enough to run into the odd period where stocks do trail bonds over a 30 year holding period.
This analysis was based on making an initial investment and letting it grow over time.
Of course, if one is capable of expertly timing the markets then it would be possible to beat the 100% stock approach in the long-term by “simply” being in the highest returning asset class each year. This will be attractive perhaps to psychics and clairvoyants. Mere mortals investing for 15 years or longer might wish to consider the 100% stock approach. However, investors that are uncomfortable with short-term volatility should use a balanced approach. And it may be realistic for long-term investors to move some money out of stocks if stock prices are in an obvious bubble.
Virtual certainty is not quite 100% certainty there is always some small chance that Bonds will outperform even in a 30 year time horizon.
You don’t have to agree with my conclusions. You can also study the graphs above and draw your own conclusions.
Self-described long-term investors need to be sure that they really have a long time horizon before they act accordingly. For many investors, there is a chance that they will need to cash out their investments early. This could be caused by illness, job loss, disability, legal problems and other reasons. But, if an investor is virtually certain that they have a very long time horizon then it certainly appears that stocks (based on a U.S. large stock index) are not riskier than bonds, in terms of achieving the highest ending portfolio value.
More Analysis:
The above analysis shows that stocks tend to significantly outperform bonds and balanced portfolios as of the end of a 30-year holding period.
But what about the volatility along the way? And what about for more realistic scenarios like saving so much per year for 30 years rather than just making a one-time deposit and waiting 30 years. And what about retirement scenarios?
We have all of that covered in two related articles:
The first article shows what happened to portfolios for all the possible 30-year savings periods from 1926 to 1955 all the way to 1982 through 2011 invested in either 1. 100% U.S. stocks (S&P 500 index fund in non-taxable account) or 2. Invested 60% in stocks, 35% in corporate bonds and 5% in cash.
The second article shows what happened to one million dollar portfolios for all the possible 30-year retirement periods from 1926 to 1955 all the way to 1982 through 2011 invested in either 1. 100% U.S. stocks (S&P 500 index fund in non-taxable account) or 2. Invested 60% in stocks, 35% in corporate bonds and 5% in cash.
END
Shawn Allen, CFA, CMA, MBA, P.Eng.
President, InvestorsFriend Inc.
Article originally created in June 2001 and last updated November 9, 2021