Fortis Inc.
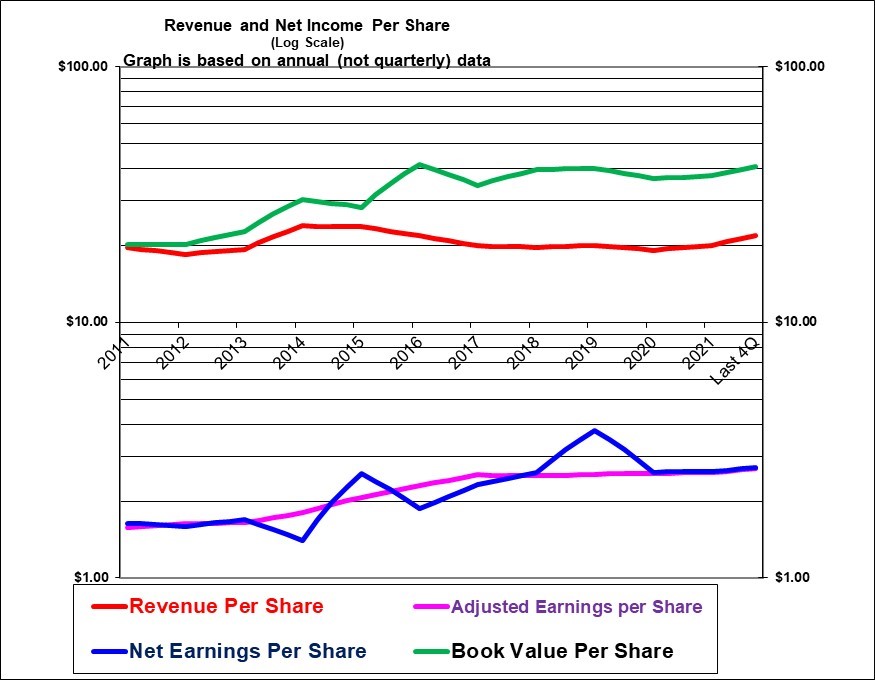
Adjusted earnings per share (the purple line) have grown steadily over the years and the growth had increased until 2017 but has been flat since (very little growth but picking up some in 2022). Revenues per share have been relatively flat or down until a gain in 2022 but this is largely driven by energy prices that are largely passed through to customers without much impact on profit. The spike in GAPP earnings in 2019 was due to selling a non-regulated hydro generation asset in B.C. at a large gain.
| Fortis Inc. (FTS, Toronto) | |
| RESEARCH SUMMARY | |
| Report Author(s): | InvestorsFriend Inc. Analyst(s) |
| Author(s)’ disclosure of share ownership: | The Author(s) hold no shares |
| Based on financials from: | Dec ’21 Y.E. + Q3 ’22 |
| Last updated: | November 6, 2022 |
| Share Price At Date of Last Update: | $ 53.35 |
| Currency: | $ Canadian |
| Generic Rating (This rating does not consider the circumstances of any individual investor and is therefore not specific advice for any individual): | Buy rated at $53.35 |
| Qualifies as a stock that could be bought with confidence to hold for 20 years? | Yes |
| Has Wonderful Economics? | Yes modest returns at a low risk |
| Has Excellent and Trustworthy Management? | Yes |
| Likely to grow earnings per share at an attractive rate over the next decade? | Yes |
| Positive near-term earnings outlook? | Yes |
| Valuation? | Fair |
| SUMMARY AND RATING: The graph of revenues per share (red line) has been relatively flat since 2011 but that was likely caused by lower natural gas and wholesale electricity prices and does not affect earnings. The adjusted earnings per share growth had been relatively steady in the mid to high single digits but has been flat since 2017. The book value per share had been growing steadily but has now been flat since 2016. The Value ratios in isolation would indicate a (lower) Buy rating. Management quality appears strong . The insider trading signal is at least moderately positive. Executive compensation for the CEO is high but is not any real concern given the size of the company. There is a risk of a price decline as interest rates rise even though earnings will likely be mostly unaffected. Management is projecting dividend growth of 4 to 6% per year through 2027. And it appears they expect earnings growth to be somewhat higher driven by their capital investment program. And the next few quarters will be boosted by the lower Canadian dollar. Overall we rate this a Buy especially for those seeking dividend income and an investment that is lower risk over the long term. | |
| MACRO ENVIRONMENT: Electric utilities are benefiting from the move to electric vehicles and the connection of wind and solar generation. They also tend to be relatively recession proof. Gas utilities are stable and are also relatively recession resistant. | |
| LONG TERM VALUE CREATION: Fortis Inc. has definitely created excellent value for its longer term and early investors. However, due to acquisitions and associated share issuances, the company is holding a lot of newer investor equity to which it has added reasonable value. A surprisingly low 17% of its common equity consists of retained earnings – partly because it pays out a high proportion of its earnings as a dividend and partly because of numerous share issuances to fund acquisitions. | |
| DESCRIPTION OF BUSINESS: Fortis Inc. is a parent or holding company that owns 10 regulated electric and gas utilities with geographic diversification across Canada and the United States (plus the Caribbean). Only about 1% of its business is unregulated. The KEY feature of Fortis is that in the absence of something unusual it will earn a very reliable return on equity. Normally (although it is not guaranteed), each dollar invested in its regulated utilities tends to quite reliably earn the regulated return. Fortis Inc. is the parent company of ITC (Midwest Transmission lines), UNS Energy (Arizona) , and Central Hudson Gas and Electric (New York) in the United States. In Canada, Fortis owns utilities in Alberta, British Columbia, Ontario, PEI and Newfoundland. The company also owns two operations in the Caribbean. Non-regulated entities include generation assets in Belize, as well as a natural gas storage facility in B.C. Assets are $64 billion and there are about 9,100 employees. As of 2021, only 34% of assets and about 38% of earnings were from Canada. | |
| ECONOMICS OF THE BUSINESS: The economics of regulated utilities are largely driven by the regulator. This appears to be a low risk business with a modest but acceptable ROE. The recent approximate 6.9% adjusted ROE should rise slightly over time as purchased goodwill (which does not earn a return) declines as a percentage of regulated assets. The recent return on ending assets is 2.00% and the return on ending equity is 6.6%. Absent goodwill (which earns nothing under regulation) the return on equity would have been far higher at about 19%. | |
| RISKS: Overall this is a lower risk investment. Risks would include lower ROE awards from regulators and any unfavorable regulatory decisions including non-allowance of portions of capital spending. In terms of the stock price (but not the earnings) higher interest rates are a near-term risk. Delays in planned capital spending are a risk. | |
| INSIDER TRADING / INSIDER HOLDING: Based on January 1, 2022 to November 6, 2022. About 12 insiders are buying (mostly quarterly) under a plan. This provides only a weak signal as it tends to be done without regard to the share price. Still, it does show confidence and in some cases they also buy for family members. Three insiders did buys in the public market including notably the CEO buying 19,000 shares at U.S. $39.10 or about $53 Canadian on November 2. Another insider bought 6000 at $52.90 on November 3 and a third insider bought on three occasions during the year paying a high as $58. Three insiders sold substantial amounts after exercising options and at prices most of over $60. Overall the insider trading signal is at least moderately positive. In terms of insider ownership there are many insiders listed and many of them own over 10,000 shares and some own over 100,000. This is a positive signal. | |
| WARREN BUFFETT’s CRITERIA: Buffett indicates that all investments must pass four key tests: the business is simple to understand and predict (pass due to relatively simple regulated operations), has favorable long-term economics due to cost advantages or superior brand power (pass due to monopoly position), apparently able and trustworthy management (pass due to past record of successful growth), a sensible price – below its intrinsic value (marginal pass), Other criteria that have been attributed to Buffett include: a low debt ratio (marginal pass), good recent profit history (pass) little chance of permanent loss of the investors capital (pass) a low level of maintenance type capital spending required to maintain existing operations excluding growth (not really relevant as capital spending is directly rewarded in this case) | |
| MOST RECENT EARNINGS AND SALES TREND: Adjusted earnings per share growth in the past four quarters, starting with the most recent, Q3, 2022 was plus 12%, plus 3%, plus 1% and minus 8%. The adjusted earnings per share growth in the past six calendar years starting with the most recent (2021) was plus 1%, unchanged, plus 2%, unchanged, plus 10%, and plus 11%. Revenue per share growth is not very relevant due to the pass-through of commodity costs. In the most recent four previous quarters the revenue per share growth was plus 9%, plus 10%, minus 3% and minus 3%. In the past six calendar years beginning with 2021 the revenue per share growth was plus 0.5%, plus 2%, plus 2%, unchanged, minus 9% and minus 8%. Overall, the recent trend in adjusted earnings per share is modest but positive – there was likely a boost from the lower Canadian dollar in Q3. The revenue per share trend has been relatively flat but due to the manner of regulation has little impact on earnings. | |
| COMPARABLE STORE SALES: Not applicable | |
| Earnings Growth Scenario and Justifiable P/E: The current P/E of about 20 can be justified with growth of about 4% combined with the 4.2% dividend yield. | |
| VALUE RATIOS: Analysed at $52.13. The price to book value ratio is not excessive for a regulated utility at 1.31 but the price to tangible book ratio (after deducting goodwill which earns nothing) is unattractively very high for a regulated utility at 3.75. (In acquisitions, Canadian regulated utilities typically trade at about twice tangible book value). The dividend yield is quite attractive at 4.2% but is based on a high payout ratio of 84% of trailing adjusted earnings. The P/E ratio based on adjusted earnings is moderately unattractive at 19.8. This could be considered too high and a risk in the face of higher interest rates. The adjusted ROE is somewhat modest (disappointingly low) at about 6.9%. (The ROE should improve over time as goodwill becomes lower relative to equity). Adjusted earnings per share growth in the past five calendar years is low at low at 2.4% but was good at 5.3% over the past ten years. The revenue per share growth in the past five years is actually negative 1.7% but this is not very relevant due to the way it is regulated. Intrinsic value is calculated at $43.45 if the per share growth for the next five years is 3% and the P/E after five years declines to 15 (which may be quite pessimistic but could happen with higher interest rates). Or $57 if the per share growth for the next five years averages 6% annually (which may require acquisitions) and the P/E after five years declines to 18. Overall, in isolation, these value ratios would support a (lower) Buy rating. | |
| TAXATION FOR INVESTORS: Nothing unusual. Importantly, the dividend qualifies for the Canadian dividend tax credit. | |
| SUPPORTING RESEARCH AND ANALYSIS | |
| Symbol and Exchange: | FTS, Toronto |
| Currency: | $ Canadian |
| Contact: | investorrelations@fortisinc.com |
| Web-site: | www.fortisinc.com |
| INCOME AND PRICE / EARNINGS RATIO ANALYSIS | |
| Latest four quarters annual sales $ millions: | $10,458.0 |
| Latest four quarters annual earnings $ millions: | $1,288.0 |
| P/E ratio based on latest four quarters earnings: | 19.7 |
| Latest four quarters annual earnings, adjusted, $ millions: | $1,282.0 |
| BASIS OR SOURCE OF ADJUSTED EARNINGS: As reported by management | |
| Quality of Earnings Measurement and Persistence: Earnings quality is high and persistence is high. There is some volatility caused by changes in the U.S. to Canadian dollar exchange rate. | |
| P/E ratio based on latest four quarters earnings, adjusted | 19.8 |
| Latest fiscal year annual earnings: | $1,231.0 |
| P/E ratio based on latest fiscal year earnings: | 20.6 |
| Fiscal earnings adjusted: | $1,219.0 |
| P/E ratio for fiscal earnings adjusted: | 20.9 |
| Latest four quarters profit as percent of sales | 12.3% |
| Dividend Yield: | 4.2% |
| Price / Sales Ratio | 2.43 |
| BALANCE SHEET ITEMS | |
| Price to (diluted) book value ratio: | 1.31 |
| Balance Sheet: (last updated for Q3, 2020) Assets are comprised as follows: 64% is utility capital assets (upon which it would normally earn a regulated return) and a further 6% is regulatory assets (which are offset by regulatory liabilities), 22% is purchased goodwill, a large portion of which is related to the 2016 ITC (Midwest U.S. Transmission) acquisition, (which for regulated utilities typically earns nothing but is paid for to acquire regulated assets in transactions that earn attractive regulated returns), 4% is current assets (which would earn a regulated return after deducting current liabilities), 2% is intangible assets such as software and land rights (which would normally earn a regulated return) and 1% is other assets. In total about 76% of the assets would normally earn a regulated return and the remaining 24% is goodwill which does not earn a return but which was paid to acquire some of the regulated assets. On the other side of the balance sheet, these assets are supported as follows: 44% debt, 31% common equity (34% including non-controlling interest equity), 3% preferred shares, 5% current payables liabilities, 6% deferred income taxes, 6% regulatory liabilities, 2% other liabilities. Overall, given the reliable earnings, this is a relatively strong balance sheet even with the substantial goodwill. | |
| Quality of Net Assets (Book Equity Value) Measurement: The concern here would be the large amount of goodwill (As of Q3, 2022 20% of assets and 65% as large as common equity!) which lowers the quality and reliability of the book value per share figure. | |
| Number of Diluted common shares in millions: | 478.2 |
| Controlling Shareholder: Fortis reports that no individual or entity owns more than 10% of the shares. In effect, senior management and the directors appear to control the company. | |
| Market Equity Capitalization (Value) $ millions: | $25,512.0 |
| Percentage of assets supported by common equity: (remainder is debt or other liabilities) | 30.4% |
| Interest-bearing debt as a percentage of common equity | 147% |
| Current assets / current liabilities: | 0.6 |
| Liquidity and capital structure: The liquidity and capital structure is strong. Fortis’ debt to common equity ratio is 147%, which is moderately high but not excessive for a regulated utility company. The credit rating for Fortis’ unsecured debt is BBB+ from Standard and Poors. | |
| RETURN ON EQUITY AND ON MARKET VALUE | |
| Latest four quarters adjusted (if applicable) net income return on average equity: | 6.9% |
| Latest fiscal year adjusted (if applicable) net income return on average equity: | 7.0% |
| Adjusted (if applicable) latest four quarters return on market capitalization: | 5.0% |
| GROWTH RATIOS, OUTLOOK and CALCULATED INTRINSIC VALUE PER SHARE | |
| 5 years compounded growth in sales/share | -1.7% |
| Volatility of sales growth per share: | Revenue per share has been relatively flat and not volatile. |
| 5 Years compounded growth in earnings/share | 6.9% |
| 5 years compounded growth in adjusted earnings per share | 2.4% |
| Volatility of earnings growth: | Modest steady growth, with little recent volatility. |
| Projected current year earnings $millions: | not available |
| Management projected price to earnings ratio: | not available |
| Over the last ten years, has this been a truly excellent company exhibiting strong and steady growth in revenues per share and in (adjusted) earnings per share? | Yes |
| Expected growth in EPS based on adjusted fiscal Return on equity times percent of earnings retained: | 1.1% |
| More conservative estimate of compounded growth in earnings per share over the forecast period: | 3.0% |
| More optimistic estimate of compounded growth in earnings per share over the forecast period: | 6.0% |
| OUTLOOK AND AMBITIONS FOR BUSINESS: Earnings per share in Canadian dollars in Q4 and quite likely the next few quarters will be boosted by the sharply lower Canadian dollar. The company is projecting continued growth and expects to increase the earnings and dividend by an average of 4 to 6% annually for the next five years. This is based on capital spending to improve the current system as well as an expansion to serve First nations territories and some expansion in transmission geography as well as investments in new generation. | |
| LONG TERM PREDICTABILITY: As a regulated utility, Fortis appears to be very predictable in the long term. However, growth may be modest unless it makes further acquisition. But electric vehicles and the need to connect various wind and solar projects are providing a relatively strong organic growth outlook. | |
| Estimated present value per share: We calculate $43 if adjusted earnings per share grow for 5 years at the more conservative rate of 3% and the shares can then be sold at a P/E of 15 and $57 if adjusted earnings per share grow at the more optimistic rate of 6% for 5 years and the shares can then be sold at a P/E of 18. Both estimates use a 7.0% required rate of return. | |
| ADDITIONAL COMMENTS | |
| INDUSTRY ATTRACTIVENESS: (These comments reflect the industry and the company’s particular incumbent position within that industry segment.) Michael Porter of Harvard argues that an attractive industry is one where firms are somewhat protected from competition based on the following four tests. Barriers to entry (Pass, each of its regulated subsidiary utilities has a monopoly service territory but it does face competition in making acquisitions). No issues with powerful suppliers (pass). No issues with dependence on powerful customers (pass), No potential for substitute products (pass) No tendency to compete ruinously on price (pass. Overall this industry appears to be attractive to an incumbent however that also depends greatly on the returns awarded by its regulators. | |
| COMPETITIVE ADVANTAGE: This does not seem applicable within each of its monopoly service territories. In acquiring additional utilities it has some advantage is in access to capital markets. | |
| COMPETITIVE POSITION: This is not applicable as the company operates regulated monopoly utilities with protected service territories. | |
| RECENT EVENTS: Despite the pandemic and weather events including hurricanes, the overall picture has been “business as usual”. In 2019, Fortis sold a newer non-regulated generation asset in B.C. for a very large gain. Fortis also issued shares in 2019 and this may have been to improve its balance sheet strength as it did not make an acquisition. Historically, Fortis has made a number of very large acquisitions, but none since 2016. | |
| ACCOUNTING AND DISCLOSURE ISSUES: The management discussion was generally clear and well organized. There could be more discussion of the regulated return on equity for each company. Also the competitiveness of the electricity charges at each utility compared to neighbouring geographies or alternative fuels could be discussed. Also the growth in revenue and expense items would be better stated as a percentage rather than in dollars. As a minor point, the number of shares should be disclosed directly on the income statement. Fortis has paid very little in current income taxes for the past six years as the great majority of its income taxes are being deferred. This was particularly the case in the U.S. It was unclear the extent to which this is benefiting customers as opposed to Fortis and there did not seem to be much discussion. | |
| COMMON SHARE STRUCTURE USED: Normal, one vote per share. | |
| MANAGEMENT QUALITY: Based on the track record, management quality appears to be high. We would note however that the company appears to focus very much on growing earnings and we have not seen it express much concern about higher rates to customers. To a certain degree, management has relied on financial engineering including using a higher debt leverage at the corporate level than allowed at the regulated utility level. | |
| Capital Allocation Skills: Fortis appears to have done well in this regard despite paying significant goodwill premiums in its many acquisitions. It continues to pay out a large portion of its earnings as a dividend, and plans to increase its dividend by an average of 4-6% annually through 2027. The company has regularly issued shares to finance acquisitions. It also continuously issues shares through its DRIP program. By both paying out a high dividend and issuing shares , Fortis is sort of “sucking and blowing” but it seems to have worked out well perhaps because the share price was not under-valued to any great degree. The return on the acquisitions appears to be acceptable but not great at a recent approximate 6.9% ROE. The high dividend payout ratio supports a relatively high share price which was then beneficial in issuing shares. The company has been successful by sticking almost exclusively to regulated acquisitions and has avoided the deregulated energy assets that have often proven volatile and problematic for certain other large Canadian utility operations. | |
| EXECUTIVE COMPENSATION: For the top five officers, total compensation for 2021 for the top five officers ranged from $2.7 million to $9.2 million. This is not excessive for the size of the company but the top end could be viewed as high. But Given the size and profitability of the company, this compensation is not much of a concern. | |
| BOARD OF DIRECTORS: Warren Buffett has suggested that ideal Board members be owner-oriented, business-savvy, interested and financially independent. The group of directors here appear to meet that criterion. | |
| Basis and Limitations of Analysis: The following applies to all the companies rated. Conclusions are based largely on achieved earnings, balance sheet strength, achieved earnings per share growth trend and industry attractiveness. We undertake a relatively detailed analysis of the published financial statements including growth per share trends and our general view of the industry attractiveness and the company’s growth prospects. Despite this diligence our analysis is subject to limitations including the following examples. We have not met with management or discussed the long term earnings growth prospects with management. We have not reviewed all press releases. We typically have no special expertise or knowledge of the industry. | |
| DISCLAIMER: All stock ratings presented are “generic” in nature and do not take into account the unique circumstances and risk tolerance and risk capacity of any individual. The information presented is not a recommendation for any individual to buy or sell any security. The authors are not registered investment advisors and the information presented is not to be considered investment advice to any individual. The reader should consult a registered investment advisor or registered dealer prior to making any investment decision. For ease of writing style the newsletter and articles are often written in the first person. But, legally speaking, all information and opinions are provided by InvestorsFriend Inc. and not by the authors as individuals. The author(s) of this report may have a position, as disclosed in each report. The authors’ positions may subsequently change without notice. | |
| © Copyright: InvestorsFriend Inc. 1999 – 2022. All rights to format and content are reserved. | |