
Time In The Market – Long Term Returns from Stocks, Bonds, T-Bills and Gold
With a full 100 years of data to the end of 2025, stocks have beaten bonds and T-Bills for every holding period, be it one year, two years or a hundred years! For the shorter time periods that is not always the case. For longer time periods it appears to always be the case.
The data source is a well-known reference book called “Stocks, Bonds, Bills and Inflation”. The annual yearbook book was published by Morningstar. (Ibbotson SBBI classic yearbook). This data starts at the beginning of 1926. Sadly, this book was recently discontinued so we had to get the data from the last few years from other sources. In addition we added Gold’s long-term performance from other sources.
Here we graphed the compounded average annual return on money invested in each of Stocks, long-term corporate bonds, T-bills in each year since 1926 and left invested through to the end of 2025.
Our data is for real (inflation-corrected) returns and shows the real return in constant purchasing power dollars. The data source assumes a tax free account and omits trading costs or assumes they are non-existent due to the buy-and-hold strategy.
In the longer term, the average annual return from corporate bonds has actually been more volatile than that from stocks. This is because bond returns on money invested any time around 1980 had high returns to date due to initial high interest rates. And investments in long term bonds made in the last decade or more and held until now have enjoyed unexpected (and temporary) capital gains due to the drop in interest rates.
The average annual real return from T-Bills for money invested for long periods has been roughly in the 1% range. The more recent figures are not long-term and have been negative.
Gold appears to have traditionally provided a real average annual compound return of 0 to 3%. The more recent figures for investments held since 2000 to 2009 are not long-term and have been higher but investments in Gold held since 2010 or 2011 have not done well.
Here is the graph of the compounded returns for Stocks, long-term corporate bonds and T-Bills. We get to gold momentarily.
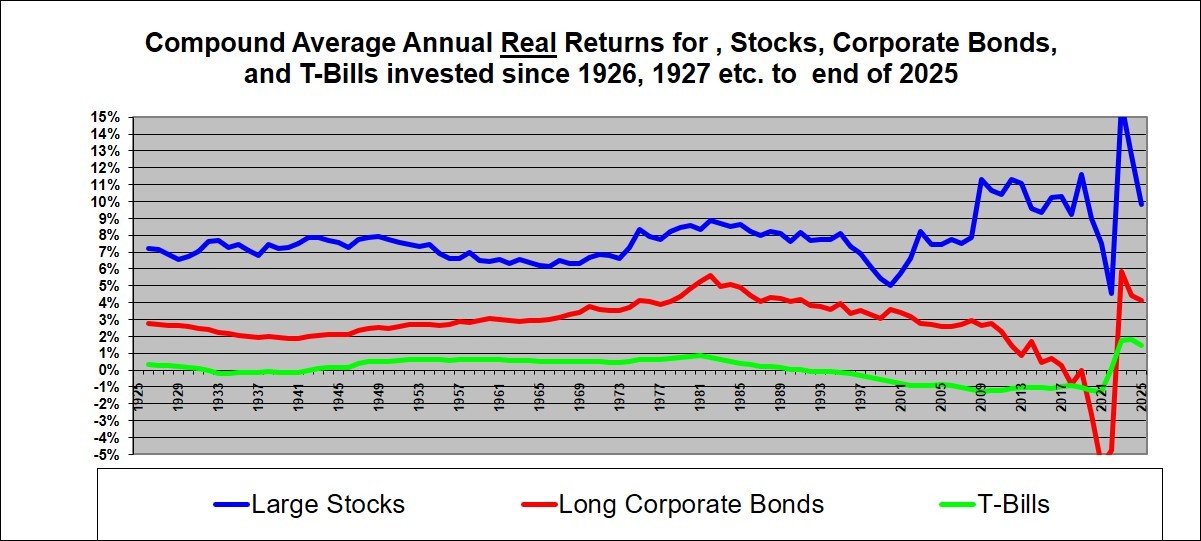
The way to read this graph is to start on the right hand side. It shows that money invested in the S&P 500 at the start of 2025 has returned about 10% after inflation. If invested since the start of 2023 the return was stellar at 15.8% compounded annually – after deducting inflation! But because 2022 saw a significant decline in the market, money invested for the four years since the start of 2022 compounded up at only 4%.
The graph shows that lump sums invested in the S&P 500 for any year all the way back to 2009 has compounded up at 10% annually or more with the exception of investments at the start of 2021 or 2022. Lump sums invested at the start of all years prior to 2009 have compounded up at less than double digit returns. But the interesting thing is that as you go back in time compounding from any year prior to 1997 (including all the way back to 1926) until the end of 2025 has consistently compounded up in the range of about 6% to 8% – again, this is after deducting inflation.
This appears to suggest that in the very long term, investing in stocks is not that risky and can be expected to return about about 7% annually in the very long run.
Turning to investments in long-term U.S. corporate bonds, the graph shows that they provided good returns for money that has been invested only since 2023, 2024 or 2025. But negative real return for money invested since 2020, 2021 or 2022 and quite poor returns for money invested since any year back to 2012. Money invested prior to 2012 has as of the end of 2025 always compounded up at a positive real return but the range has been wide – from only about a 2% compounded real return for money invested in years from the mid 1930’s to the mid-1940’s all the way up to a strong 5.6% compounded real return for money invested in long-term corporate bonds at the start of 1982.
In the very long term it appears that the S&P 500 has provided a reliably higher compounded than return than long-term corporate bonds.
Looking at investments in U.S. treasury bills, in the past three years, they have provided an unusually “strong” compounded real return of 1.4 to 1.8%. But in the long run the real return from treasury bills is roughly 0%. They preserve wealth but do not grow wealth.
The next graph is the same as the above but adds Gold.
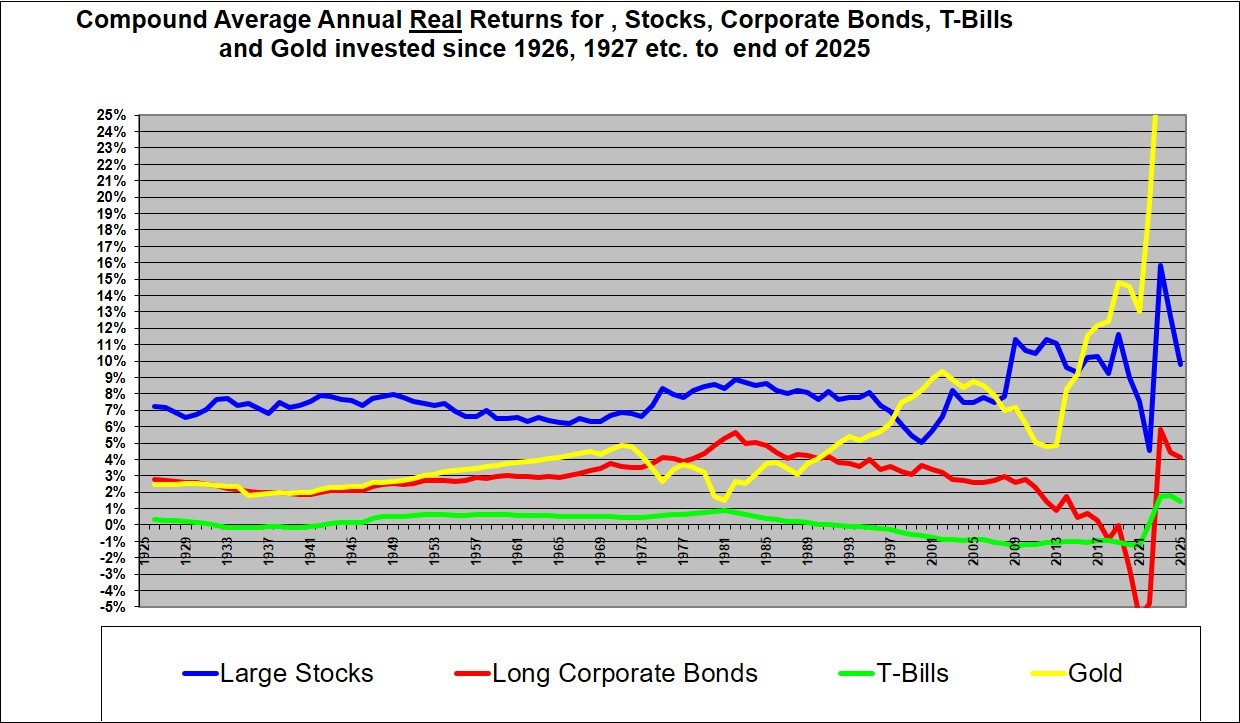
Money invested in gold for the past few years has had return that are literally off the chart. Gold was up 61% in 2025 even after deducting inflation. Gold has compounded up at double digits for investments started in any year all the way back to 2106. Money invested in gold around 2012 has not not compounded up as highly as the S&P 500 but was still a good investment. Historically money invested in gold in any year prior to 1998 has not compounded up as highly as money invested in the S&P 500 in the same years. Based on the results for money invested a fter about 1998, gold could certainly earn a place in a portfolio.
Will Gold be a great investment over the next decade or longer? I don’t know the answer to that and I don’t think that this chart can help much. The reasons behind the rise in the price of Gold are debatable. Many would argue that Gold had been bid up out of fear that the U.S. dollar will collapse and/or hyper-inflation will reign. That may or may not be the case.
Conclusion
This information on the returns made by past investors in the different asset classes should assist investors to invest with knowledge. However, at the end of the day the future is not the past, the long-term can be very long in arriving and investors ultimately “pays their money and takes their chances”. Past evidence suggests that if you spend enough time in the stock markets (on a buy and hold basis), you will eventually have a good time in the stock market.
The above graphs are for one-time investments made in each year and held until the end of 2025. Results from investing annually would differ and we have other articles that explore that.
END
Shawn
Allen, CFA, CMA, MBA, P.Eng.
President
InvestorsFriendInc.
Originally Written in early 2011 and updated July 23, 2026.