
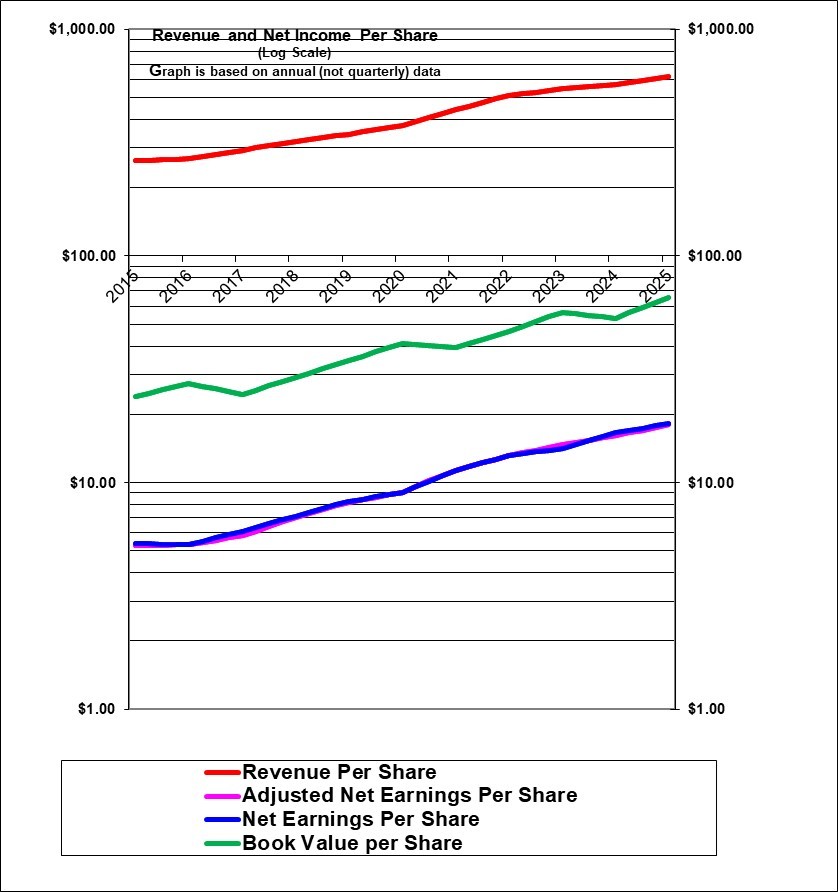
The Chart shows that annual revenues and earnings per share for Costco have increased at a strong and very steady rate. (And note that this graph rises 1000 fold from top to bottom.) The fact that the earnings line is so far below the revenue line is due to the thin net profit margins that are typical of retail (only 2.9% in the case of Costco, though that is by design as they focus on being a low price leader and it includes gasoline sales). The decline in book value in 2024 was due to a special dividend and is not a concern at all.
| Costco (COST, New York) | |
| RESEARCH SUMMARY | |
| Report Author(s): | InvestorsFriend Inc. Analyst(s) |
| Author(s)’ disclosure of share ownership: | Author(s) hold shares |
| Based on financials from: | Aug ’25 Y.E. |
| Last updated: | December 28, 2025 |
| Share Price At Date of Last Update: | $ 873.00 |
| Currency: | $ U.S. |
| Generic Rating (This rating does not consider the circumstances of any individual investor and is therefore not specific advice for any individual): | Weak Buy / Hold at $873 |
| Qualifies as a stock that could be bought with confidence to hold for 20 years? | Yes! |
| Has Wonderful Economics? | Yes! |
| Has Excellent and Trustworthy Management? | Yes |
| Likely to grow earnings per share at an attractive rate over the next decade? | Yes |
| Positive near-term earnings outlook? | Yes |
| Valuation? | Expensive |
| SUMMARY AND RATING: As the graph illustrates, over the past ten years Costco has recorded very good revenue per share growth (specifically 10.5% compounded over the past five fiscal years and 9.0% average over the past ten years) growth in revenues per share. Earnings per share growth averaged an exceptional 14.8% annually the past five fiscal years and 13.1% for past ten years. Very importantly, Costco seems very predictable. It seems almost certain that it can keep growing earnings per share relatively steadily (although probably at a lower rate) in the next ten and even 20 years. Costco does well on Buffett’s tenets (except, importantly Costco is not apparently selling at a bargain price). The value ratios indicate that it is a very strong company but is arguably over-valued and could be rated somewhere in the Sell range. The very recent earnings trend remains very strong. Costco has very strong competitive advantages in its low-cost structure, recognized brand, Kirkland Brand. trusted low prices, and disciplined management systems. The insider trading signal is moderately negative although a weak signal. The outlook appears to be for long-term growth conservatively in the 8 to 10% range given same store revenue growth of about 6% and a 3% increase in the store count annually plus probably some additional earnings growth due to scale. Near-term growth however may be somewhat lower due to the predicted recession and lower inflation. They could likely increase profits at will by raising the mark-ups but they favor a strategy of lower profits to boost the brand identity as a place for bargains. They could also easily increase the dividend. Overall we rate it a Weak Sell / Hold at $873. It’s an extremely excellent business but the forward P/E of 48 is very expensive. Canadian investors obviously face currency risk if the Canadian dollar rises after investing in this U.S. company. In summary, this is a business with exceptionally good economics and very strong and predicable prospects but which is appears somewhat too expensive at this time. It is a high quality stock for a very long-term holding but appears at risk for some additional pull-back in price. The numbers suggest that those owning it should reduce their position due to valuation, but selling this high quality company due to valuation concerns has historically been a mistake so be aware of that. | |
| MACRO ENVIRONMENT: A possible U.S. (due to tariffs and perhaps the normal cycle of the economy) will probably NOT have a big impact on Costco given its focus on food and on low costs. Nevertheless it would be a headwind. If the U.S. really did expel millions of illegal residents that would surely lower demand in the U.S. | |
| LONG TERM VALUE CREATION: Updated December 2025, there can be no doubt that Costco has a terrific record of long-term value creation. Its balance sheet recently showed $8.3 billion of invested capital and $22.65 billion of retained and comprehensive earnings. And the company has paid out substantial amounts in dividends (currently $2.2 billion per year) and in large special dividends (most recently a $6.7 billion payout in early 2024 but that is not done every year at all) and has also bought back a modest amount of shares. And, each dollar of book value trades in the market at $18! | |
| DESCRIPTION OF BUSINESS: (As of September 2025) Costco operates large members-only warehouses based on the concept that offering members very low prices on a limited selection basis of nationally branded and selected private label brands in a wide range of merchandise categories will produce high sales volumes and rapid inventory turnover. It describes its business model as “continually providing goods and services at the lowest prices”. It can be categorized as a retailer although some of its sales are truly wholesale as small retailers use it as their wholesale supplier. It is one of the largest “retailers” in the U.S. and the seventh largest is the world. The average Costco size is 144,000 square feet (about 380 feet by 380 feet). It has 923 warehouses (stores) throughout the USA (633, 69%), Canada (114, 12%), Mexico (42, 4.6%), the United Kingdom ( 29, 3.1%), South Korea (20, 2.2%), Taiwan (14, 1.5%), Japan (37, 4.0%), and Australia (15, 1.6%), Spain 5 stores, France 3 and 7 in China. 2 in Sweden Iceland, and New Zealand. It is interesting to note that there is only ten stores in Europe outside of the U.K. and only seven in China and none in South America. They appear to concentrate in a limited number of countries. It also has 23 distribution depots that receive some shipments from manufacturers and then redistribute these usually within 24 hours to individual Costco locations. Net income is only about 2.9% of the revenue amount. (Therefore the slightest change in margins has a large impact on earnings.) Costco owns virtually all of its own buildings and the vast majority of the land as well. There are 81 million members most of whom pay $65 per year. But about 55% of U.S. and Canadian members are executive members and pay an additional $65 and account for about 75% of revenue. (And there are an additional approximate 64 million secondary household member cards with no extra fee). An average store does $272 million in revenue per year. Their private label Kirkland products accounts for about 33% of global sales or 37% excluding gasoline. | |
| ECONOMICS OF THE BUSINESS: Costco has very good and very stable economics. It is one of the largest retailers in the U.S. and the seventh largest in the world. It has significantly lower costs than key competitors including Walmart and Target. We suspect that its costs are lower than Amazon’s considering that Amazon incurs the cost of delivery to the customer. It has a cost structure that enables it to be highly profitable despite having the lowest prices. It continues to increases sales and profits per share by adding new stores and growth in same-store sales. Its advantages are likely to be enduring. In 2025 it achieved an ROE on ending equity of 27% (typical for Costco) even though profits on sales were just 2.9%, The 2.9% was leveraged up by revenues that were 3.57 times assets and assets that were 2.64 times the ending common equity level. | |
| RISKS: Please see annual report for a discussion of risks. In our view, the major risks include competition, and general economic factors, and product liabilities . The fact that its net profit margin is a thin 2.9% of revenue (this is in keeping with its strategy to be a low-price leader) adds to the risks. However, we think they could raise prices a certain amount at will. (They have left pricing power on the table in order to be a low price leader). Product liability and reputation is always a risk. | |
| INSIDER TRADING / INSIDER HOLDING: Based on insider trading in 2025 to December 28: Yahoo Finance shows that insiders sell somewhat regularly over the years and with no apparent regard to price. However, the sales are not that frequent with only 11 insiders selling in 2025 and only two of those with two sales, the rest with just one sale during the year. These sales were at prices higher than current – ranging from $900 to $1014. Overall this is a moderately negative insider trading signal but not a strong signal given that the sales historically appear to be done without much regard to price. Costco itself buys back modest amounts of shares most quarters with apparently little or no regard to the share price. | |
| WARREN BUFFETT’s CRITERIA: Buffett indicates that all investments must pass four key tests: the business is simple to understand (pass, warehouse retail concept with low costs), has favorable long-term economics due to cost advantages or superior brand power (pass, costs are low due to its huge scale and volume, fast inventory turn over, warehouse style, control of theft by monitoring doors, low advertising, the fact that goods are sold before they need to be paid for, limited hours and limited acceptance of credit cards (and with an affiliated credit card) and it has brand value – seen as trusted for low prices), apparently able and trustworthy management (pass), a sensible price – below its intrinsic value (apparent fail at 43 times forward P/E), Other criteria that have been attributed to Buffett include: a low debt ratio (pass, modest debt), good recent profit history (pass) little chance of permanent loss of the investors capital (pass) a low level of maintenance type capital spending required to maintain existing operations excluding growth (pass) | |
| MOST RECENT EARNINGS AND SALES TREND: Adjusted earnings per share in the past eight quarters starting with the most recently reported being Q4 fiscal 2025 which quarter ended August 31, 2025, were up 14%, up 13%, up 8%, up 10%, up 6%, up 14%, up 12%,and up 12%. Revenues per share in the same quarters rose 8%, 8%, 9%, 7%, 1% (probably due to lower gasoline prices) 9%, 6%,and 6%. In fiscal 2025 adjusted earnings per share rose 12%, and revenues per share rose 8%. In fiscal 2024, adjusted earnings per share rose 10%, and revenues per share rose 5%. In fiscal 2023, adjusted earnings per share rose 12%, and revenues per share rose 7% – given inflation, volume growth was apparently low in 2024 and 2023, In fiscal 2022, adjusted earnings per share rose 16%, and revenues per share rose 16%, In fiscal 2021, adjusted earnings per share rose (an eye-popping ) 26%, and revenues per share rose 17% In fiscal 2020, adjusted earnings per share rose 10% and revenues per share rose 9% (fiscal 2020 benefited from about 6 months of the COVID bump). In fiscal 2019, adjusted earnings per share rose 17% boosted by lower income taxes and higher membership fees. Fiscal 2018 had earnings per share up 20% and revenue per share up 9.5% and that was despite 2017 having an extra week and was boosted by lower income taxes and higher membership fees. The recent earnings growth is quite strong and the revenue growth per share is also strong. | |
| COMPARABLE STORE SALES: Same store sales growth (adjusted for currency and gasoline price fluctuations) was 6.4% in October and 6.8% in September and in the past eight quarters, starting with the most recent being Q4 fiscal 2025 ended August 31, 2025 were up 6.4%, up 8.0%, up 9.1%, up 7.1%, up 6.9%, up 6.5%, up 5.8%, and up 3.9%. In fiscal 2025 ended August 31, the gain was up 7.6%, In fiscal 2024 ended September 1, adjusted same-store sales were up 5.3%. In fiscal 2023 ended September 3, adjusted same-store sales were up 5%. In fiscal 2022 ended August 28, adjusted same-store sales were up 11%. Some of the recent increases are due to inflation but Costco does not reveal the specific impact of inflation. However, the 2025 annual report indicates that traffic was up 5% and basket size in dollars up only 1% which may indicate limited impact of inflation (or more smaller trips). Same-store sales growth had cooled somewhat versus the torrent pace of the previous few years but has been strong in recent quarters. Historic data: In fiscal 2021 ended August 29, same store sales were up 13% (boosted by the COVID rush and despite having lapped the first six months of COVID). In fiscal 2020 ended August 30, same store sales were up 9% (with six months boosted by the COVID rush). In fiscal 2019 ended September 1, 2019, same-store sales were up 6%, In fiscal 2018 ended September 2, 2018, same store sales were up 7%. In fiscal 2017 ended September 3, 2017, same store sales were up 4%. In fiscal 2016 ended August 28 same store sales were up 4%. In fiscal 2015 ended August 30 same store sales were up 7%. In fiscal 2014 ended August 31 same store sales were up 6%. In fiscal 2013 ended September 1 2013, same store sales were up 6%. In fiscal 2012 ended August 2012, same store sales were up 6%. | |
| Earnings Growth Scenario and Justifiable P/E: The trailing P/E of 48requires significant growth such as 13% annual growth for 10 years and the current dividend pay-out ratio of about 29% followed by long-term growth of 6% and a higher dividend at 50% of earnings. Alternatively 20% earnings growth for 5 years assuming the shares can be sold at a lower but still hefty P/E of 30 in five years. These calculations assume a 7.0% required return and so effectively assume a return to somewhat lower inflation. | |
| VALUE RATIOS: Analyzed at a price of $873. The price to book value ratio, in isolation, seems unattractively very high at 13!, however it’s not at all essential that this ratio be attractive if the earnings support the price and this high ratio is a testament to Costco’s high ROE. The dividend yield is very low at 0.6%, despite recent dividend increases. (This excludes any occasional special dividends). The dividend payout ratio amounts to 29% of trailing earnings (there have also been special dividends and share buy-backs) . The adjusted trailing earnings P/E is extraordinarily high, even for this high quality company, at 48! It has historically been over 38 most of the time for many years and in 2021 was well over 40 and was recently as high as 56 -n much of 2025 and 2024 . It seems reasonable to assume that Costco’s P/E ratio will decline. Earnings per share have grown at an average 14.8% over the past five fiscal years (to August 31, 2025), which is very good indeed. Revenues per share have grown at 10.5% compounded annually on average in the past five years (to August 31, 2025). The ROE in the last 12 months is extremely strong at 30%. We calculate an intrinsic value of just $425based on 6% growth for five years and the P/E regressing to 25 (which is probably extremely conservative) and $751 with 10% growth and a terminal P/E of 35 (which is not overly conservative). The discount rate or required return used in these intrinsic value calculations is 7.0%. Overall, these value ratios indicate an extremely strong company but which appears to be at least somewhat over valued and therefore indicating a rating of perhaps (lower) Sell despite being a very (very) strong company. | |
| TAXATION FOR SHARE OWNERS: Nothing unusual. For Canadians the dividend tax credit of course does not apply. There is a dividend withholding tax for Canadians except in RRSP accounts. For Canadians, the lower tax rate on capital gains applies even though it is a foreign investment. | |
| SUPPORTING RESEARCH AND ANALYSIS | |
| Symbol and Exchange: | COST, New York |
| Currency: | $ U.S. |
| Contact: | www.cost.com |
| Web-site: | www.cost.com |
| INCOME AND PRICE / EARNINGS RATIO ANALYSIS | |
| Latest four quarters annual sales $ millions: | $275,235.0 |
| Latest four quarters annual earnings $ millions: | $8,099.0 |
| P/E ratio based on latest four quarters earnings: | 47.9 |
| Latest four quarters annual earnings, adjusted, $ millions: | $7,999.0 |
| BASIS OR SOURCE OF ADJUSTED EARNINGS: Adjustments to earnings as identified by management have been very minor. We added back just one third of the COVID costs identified by management since COVID also drove higher sales. | |
| Quality of Earnings Measurement and Persistence: The persistence and quality of earnings is excellent with continuous annual earnings growth over the last ten years. The earnings measurement is very straight forward with minimal estimated items. The earnings appear to be somewhat conservatively calculated given the use of LIFO accounting and the expensing of pre-store-opening costs. The earnings may possibly be understated by the inclusion of depreciation expense on buildings that have in the past likely increased in value, but this last is not for certain going forward. | |
| P/E ratio based on latest four quarters earnings, adjusted | 48.5 |
| Latest fiscal year annual earnings: | $8,099.0 |
| P/E ratio based on latest fiscal year earnings: | 47.9 |
| Fiscal earnings adjusted: | $7,999.0 |
| P/E ratio for fiscal earnings adjusted: | 48.5 |
| Latest four quarters profit as percent of sales | 2.9% |
| Dividend Yield: | 0.6% |
| Price / Sales Ratio | 1.41 |
| BALANCE SHEET ITEMS | |
| Price to (diluted) book value ratio: | 13.31 |
| Balance Sheet: The balance sheet is very strong. | |
| Quality of Net Assets and Book Value Measurement: The quality of the assets are high, which causes the measurement of the net equity or book value figure to be conservatively stated compared to market value. Current assets are high quality as the major component is inventory that can readily be exchanged for cash with rapid turnover. Land, buildings and improvements are worth FAR more than the accounting values which are stated at the lower of cost minus considerable depreciation or market value. Their stores would be highly attractive locations to competitors. There is no purchased goodwill or the equivalent shown on the summary balance sheet. However, the shares trade at 16 times book value as of March 10, 2025, which means that the company is very much valued for its earnings and not its assets. | |
| Number of Diluted common shares in millions: | 444.7 |
| Controlling Shareholder: There are no controlling shareholders. Institutions like pension and mutual funds own a high percentage of the shares. | |
| Market Equity Capitalization (Value) $ millions: | $388,228.3 |
| Percentage of assets supported by common equity: (remainder is debt or other liabilities) | 37.8% |
| Interest-bearing debt as a percentage of common equity | 20% |
| Current assets / current liabilities: | 1.0 |
| Liquidity and capital structure: It has very strong liquidity with relatively modest debt at a recent 20% of the equity level (and the equity is worth FAR more than book value). | |
| RETURN ON EQUITY AND ON MARKET VALUE | |
| Latest four quarters adjusted (if applicable) net income return on average equity: | 30.3% |
| Latest fiscal year adjusted (if applicable) net income return on average equity: | 30.3% |
| Adjusted (if applicable) latest four quarters return on market capitalization: | 2.1% |
| GROWTH RATIOS, OUTLOOK and CALCULATED INTRINSIC VALUE PER SHARE | |
| 5 years compounded growth in sales/share | 10.5% |
| Volatility of sales growth per share: | Strong steady growth |
| 5 Years compounded growth in earnings/share | 15.1% |
| 5 years compounded growth in adjusted earnings per share | 14.8% |
| Volatility of earnings growth: | Strong Steady growth |
| Projected current year earnings $millions: | not available |
| Management projected price to earnings ratio: | not available |
| Over the last ten years, has this been a truly excellent company exhibiting strong and steady growth in revenues per share and in (adjusted) earnings per share? | Yes |
| Expected growth in EPS based on adjusted fiscal Return on equity times percent of earnings retained: | 21.5% |
| More conservative estimate of compounded growth in earnings per share over the forecast period: | 6.0% |
| More optimistic estimate of compounded growth in earnings per share over the forecast period: | 10.0% |
| OUTLOOK AND AMBITIONS FOR BUSINESS: The store count continues to increase modestly such as close to 3% per year. To date it appears able to pass on most of the inflation driven cost increases or to have suppliers absorb that. It seems set to continue to achieve earnings per share growth possibly at the historic growth of perhaps 8 or 9%. Longer term, they appear set to continue to grow same-store sales and to open new stores. It appears that they could increase profits by charging higher margins but there is no indication that they plan to do so and in fact it would go against their philosophy to offer the lowest prices. They are also increasing profits due to increases economies of scale. Overall it seems reasonable to forecast earnings per share growth of about 8% to 10% going forward. The company has only just begun (February 2025) to use individually targeted and customised email marketing. But in the near term with recession concerns and lower inflation it seems likely that same-store sales growth will be modest and earnings growth could be lower. | |
| LONG TERM PREDICTABILITY: It seems highly certain that Costco will continue to grow and be more profitable in the next ten and twenty years. It could conceivably grow faster than the economy for at least the next 20 years as it expands internationally. | |
| Estimated present value per share: Note that Costco’s trailing adjusted earnings P/E ratio is currently 48 which is extraordinarily high. We calculate just $454 if adjusted earnings per share grow for 5 years at the more conservative rate of 6% annually and the shares can then be sold only at a much reduced P/E of 25 (but it seems very unlikely that the P/E would drop that low) and $751 if adjusted earnings per share grow at the more optimistic rate of 10% for 5 years and the shares can then be sold at a lower (but still quite high) P/E of 35. Both estimates use a 7.0% required rate of return. | |
| ADDITIONAL COMMENTS | |
| INDUSTRY ATTRACTIVENESS: (These comments reflect the industry and the company’s particular incumbent position within that industry segment.) Michael Porter of Harvard argues that an attractive industry is one where firms are somewhat protected from competition based on the following four tests. Has barriers to entry (pass, as it is difficult to now develop the brand and scale of Costco). No issues with powerful suppliers (pass, suppliers are not concentrated). No issues with dependence on powerful customers (pass, dispersed consumers), No potential for substitute products (pass, Wal-Mart’s Sam’s Club and BJ Wholesalers are strong competitors but ultimately the broad range of products purchased will be purchased someplace) No tendency to compete ruinously on price (pass, particularly for Costco which is the low-cost leader). Overall this industry appears to have attractive characteristics for Costco as a large incumbent. | |
| COMPETITIVE ADVANTAGE: Warren Buffett has stated that a low-cost structure is a competitive advantage for Costco. Their gross margin (and we include membership fees as revenue) is only about 15% (versus Wal-Mart at about 25%) and this proves that they have a low cost structure to be profitable at such a low mark-up. The membership based approach may also be an advantage given that they have contact information for each of their customers. In fiscal 2024, membership fees were 1.9% of revenue and were equal to 50% of pre-tax income. But we don’t think one can really say that 58% of profits “came from” membership fees given that those fees can’t exist without the rest of the business. The membership fees encourage repeat business. The requirement to be a member reduces theft. The Kirkland Brand representing 32% of sales in fiscal 2020 is a competitive advantage since customers cannot buy it elsewhere and it likely results in lower costs from suppliers. The cost structure advantages identified by management include low shrinkage by monitoring the doors to allow in members-only and to check for cash register receipts on exit. Lack of working capital investment since goods are sold by the time vendors need to be paid, warehouse setup lowers product handling and building costs, limited product selection lowers costs, very limited spending on advertising, shorter hours of operation, only limited acceptance of credit cards and no-doubt with a low fee negotiated, and the fact that revenue from memberships allows lower prices to be charged. Charlie Munger stated that Costco has the advantage of being trusted to offer low prices (and more so than Amazon, Charlie said). | |
| COMPETITIVE POSITION: Its market share of the overall goods that it sells is unknown (it competes against many other categories of retail including notably grocery stores and department stores). It is the dominant player in warehouse style stores in the U.S. and virtually the only warehouse style retail operator in Canada. | |
| RECENT EVENTS: It’s been business as usual. The store count was increased by a net 24 or 2.7% in 2025 and by 29 or 3.4% in 2024.The store count was increased by 29 or 3.3% and by 2.6% in 2023 which added 22 stores. | |
| ACCOUNTING AND DISCLOSURE ISSUES: The annual report is written in a reader friendly format. The accounting appears to be somewhat conservative in that store pre-development costs are expensed (but this is a tiny impact) and LIFO inventory accounting usually leads to slightly lower profit. In addition buildings are depreciated even though they may be increasing in market value. A recent accounting change has the company getting a tax benefit for stock-based compensation. This has to do with the rights vesting and/or being exercised at a different stock price than when issued. We have in some years deducted that benefit in adjusted earnings given that the company singles it out as apparently a non-recurring item. | |
| COMMON SHARE STRUCTURE USED: Normal, one share one vote. | |
| MANAGEMENT QUALITY: Excellent. Management has consistently stuck to an established way of operating that has worked very well. At the same time, they have developed some e-commerce business and added some business-focused stores. They have also invested in a delivery business to complement e-commerce and to help get larger items to customers. And they have expanded internationally at a conservative pace. | |
| Capital Allocation Skills: Management appears to have made good choices in investing its capital and in its financing. In particular it sticks to its established retail format and does not (to any material extent) invest in alternative formats – although it has invested in e-commerce. In more recent years it added moderately to debt which allowed more leverage and a higher ROE and funded large special dividend on several occasions. It has done share buy backs but has been relatively conservative in doing so which seems wise as the stock was seldom (if ever) demonstrably cheap. | |
| EXECUTIVE COMPENSATION: From December 2025 proxy document. Total compensation ranged from $520 million to $13.9 million for the five named officers. For this large company with 2025 net earnings of $8,000 million this overall compensation is not a concern. | |
| BOARD OF DIRECTORS: The ten members are well qualified. All directors own shares worth mostly in the range of $3 to $23 million. These shares were likely accumulated mostly as director compensation. We consider this to be a strong Board. | |
| Basis and Limitations of Analysis: The following applies to all the companies rated. Conclusions are based largely on achieved earnings, balance sheet strength, achieved earnings per share growth trend and industry attractiveness. We undertake a relatively detailed analysis of the published financial statements including growth per share trends and our general view of the industry attractiveness and the company’s growth prospects. Despite this diligence our analysis is subject to limitations including the following examples. We have not met with management or discussed the long term earnings growth prospects with management. We have not reviewed all press releases. We typically have no special expertise or knowledge of the industry. | |
| DISCLAIMER: All stock ratings presented are “generic” in nature and do not take into account the unique circumstances and risk tolerance and risk capacity of any individual. The information presented is not a recommendation for any individual to buy or sell any security. The authors are not registered investment advisors and the information presented is not to be considered investment advice to any individual. The reader should consult a registered investment advisor or registered dealer prior to making any investment decision. For ease of writing style the newsletter and articles are often written in the first person. But, legally speaking, all information and opinions are provided by InvestorsFriend Inc. and not by the authors as individuals. The author(s) of this report may have a position, as disclosed in each report. The authors’ positions may subsequently change without notice. | |
| © Copyright: InvestorsFriend Inc. 1999 – 2025. All rights to format and content are reserved. | |