InvestorsFriend.com Newsletter September 28, 2002
My newsletter this month includes some heavy reading regarding the fundamentals of growth and return and the evidence that stocks will almost certainly out-perform bonds in the long run, despite the recent crash. Understanding this material will allow investors to make more informed decisions and to put the recent crash into perspective.
Membership and Newsletter Subscriptions
Note that I am now asking new visitors to the site “subscribe” to the newsletter rather than to join the “membership”. It is the exact same thing and you “members” are of course already subscribers. Please don’t “subscribe” again since you already are subscribed to the newsletter.
Stocks to Buy?
I don’t have many new or updated research reports this month. I expect to have a fair number next month as the Q3 reports come in. I plan to offer a package of reports for sale at that time.
For this time I decided to give several reports free of charge. Two new reports are posted on the home page of the Site.
And for members only, here is a link to an updated report on Canadian Western Bank. A simple profitable bank doing business in the strongest economic area of the Country.
The Relationship Between Growth and Rate Of Return
It is now apparent that investors in the 1990’s were pricing too much growth into stocks. The prices of many shares implied that investors expected perpetual earnings growth of 15% annually or more.
At this time it is wise to review some of the fundamentals limits and truths about growth.
Warren Buffett has argued that average or total corporate earnings cannot sustainably grow faster than the general economy. Rather corporate earnings should be expected to remain about constant as a percentage of the total GDP.
The long run average growth in the North American economy is often estimated to be no more than 5% (2% inflation plus 3% real growth). Warren then argues that the total average return to shareholders should therefore be expected to be no more than 7% being 5% for growth plus an average 2% dividend yield.
I have developed a series of articles exploring the relationship between growth and return.
My major conclusions and observations are that.
- The essence of value investing is to insure that the growth that you expect will occur is considerably higher than the growth that is “priced-in” to the stock. It’s not good enough to know that the company should grow earnings per share at 20%. You must also know how much growth you are paying for (in advance) in the share price.
- A sustainable P/E for a company that will grow at the same rate as the general economy is 12.5 if investors require an 8% return and 14.3 if investors require an average return of 7%. Faster growing companies can logically command higher P/Es while slower growing company’s deserve lower P/Es. Faster growth should be considered to be temporary. It might last for a decade or more but no company can forever grow faster than the general economy.
- A P/E of 20 requires ambitious growth if the required return is 8% or higher. For example, a zero dividend stock that grows earnings at an impressive 13% annually for ten years and then reverts to growing at 4% and paying a 50% dividend in the long run deserves a P/E of only 20.
- An 8% return requires a stock (where the P/E is expected to be stable) to offer a combination of earnings growth plus dividend yield of 8%. Anything less would reduce the return below 8%.
- It is unrealistic to expect stocks on average to offer a return of more than 8%. (And 7% is more likely) An 8% return will require a combination of growth per share and dividends that add to 8%. Dividend yields on the DOW are averaging only 2% and it is unrealistic to think that earnings can grow at more than 6% when the economy is only growing at about 5% including inflation.
- Larger returns are possible by looking for individual under-valued stocks and by focusing on smaller companies. Small companies can sustain high growth rates much longer than large companies can.
IS THE DOW JONES (STILL) OVER VALUED?
My latest analysis of this issue, suggests that the Dow Jones Industrial average was not under-valued at a recent 7842. This article explores exactly what kind of growth assumptions are required to justify the DOW being at various levels.
THE MARKET IS VOLATILE, AND ALWAYS HAS BEEN – GET OVER IT!
The market does seem grim… The DOW is down 34% from its January 14, 2000 high. The TSX is down 46% since September 1 2000 and the NASDAQ is down 76% from its March 10, 2000 high.
However, we should keep in mind that the broader market index and in particular the DOW has recovered from similar losses in the past.
From September 3, 1929 to July 8, 1932, the DOW fell 89% from 381.17 to bottom out at 41.22. Despite that huge drop which took 25 years to recover, an investor who went into the Large index stocks at the start of 1929 and held for 20 years made a compounded annual average real (after inflation) return of 7.1% (mostly from dividends), while an investor in bonds made a compounded 5.4% return.
Investors who were in stocks throughout the great crash and who continued buying would have made very good returns over a 20 year period, and much better than in bonds.
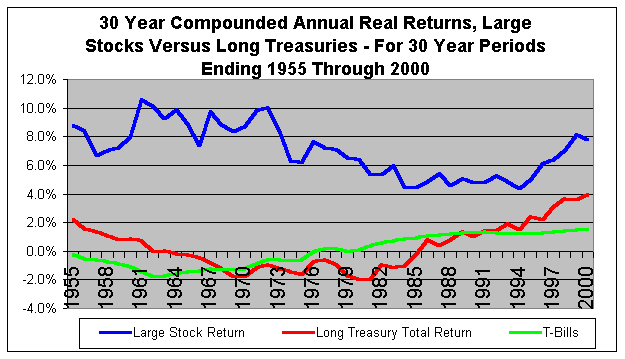
The point is that over almost all 20 and over all 30 year periods since prior to 1900, stocks out-perform bonds and this is despite the occasional 50% and even one 89% drop in the index. This illustrated by the following graph and note that it shows that stocks far outperformed bonds in all 30 year periods including the one that started January 1, 1929 and ended December 31, 1958. It shows real average annual compounded returns, after deducting inflation.

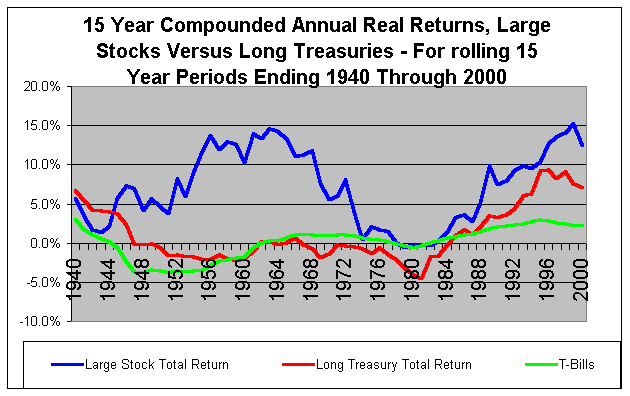
Even for 15 year periods, stocks rarely under-perform bonds and this assumes a one time purchase held for 15 years. Only when the 15 year holding period started just prior to the huge drop of 1929-1932 do stocks fail to outperform, and as noted above by holding for 20 years even the impact of the 1929- 1932 crash was over-come and stocks proved superior to bonds.
Note that bonds often have trouble keeping up with inflation. A zero percent real return means the bond just kept up with inflation.

For more detail see http://www.investorsfriend.com/what_is_risk.htm
Note that my data is from Ibbotson Associates publication “Stocks, Bonds, Bills and Inflation” which is the most widely quoted data source for historical asset returns.