InvestorsFriend Newsletter December 1, 2024
Long-term interest rates are now significantly higher than they were in 2020 and 2021. They have become more attractive for both the interest rate and the potential for capital gains if interest rates decrease. A reasonable strategy might be to take a modest in position in long term bonds at this time with a view to adding to that if long-term interest rates rise.
LONG TREASURY BONDS MAY BE TIMELY
The interest rate and yield on a 20-year US Treasury bond is currently 4.45%. That’s not a great interest rate and yield to maturity. But it’s a heck of a lot more attractive than the 1% that it bottomed out at in August 2020 and the 2% that it averaged for the year in 2021.
Whether a 4.4% locked in risk-free (in nominal dolalr terms) interest rate is attractive depends on the outlook for the direction of long-term rates and the level of future inflation.
During much of 2024, the expectation was that US Federal Reserve rate cuts would also pull down the rate on long-term bonds. On that expectation, the yield fell from a maximum of 4.9% in April to a low of 4% in September. But then the market began to focus on fears of a resurgence of inflation and on the high US debt levels. The yield rose back to 4.7% before retreating in the past tens days.
In my view a 4.45% 20-year bond interest rate is high enough to at least nibble on US long-term bonds. (But if the rate goes back to the 4.9% it was at earlier this year – higher – that wopuld certainly be more attractive.)
If the yield on that bond rises, we will suffer a loss in market value. In fact, the capital loss on a 20-year bond would be dramatic if long-term interest rates rose substantially, which is always a possibility. For that reason, I suggest that investors consider taking only a modest position in long-term bonds currently.
If long-term interest rates do rise, investors will have the opportunity to add to the position at a lower price.
In any case, an individual US Treasury bond will always mature at par if held until then.
If the yield on that long-term bond falls, then we we’ll have a capital gain and could sell the bond for a profit.
When buying individual bonds, investors should always be aware of the bid/ask spread, which essentially constitutes a hidden commission. In checking with my online broker, for a US$10,000 face amount, I was quoted a bid/ask spread of 1.34% plus a commission of $40. With that high of a bid/ask spread, investors should be prepared to hold for years or until maturity.
Those interested should check with their broker to see what individual long-term bonds they have and what the bid/ask spread on those bonds is.
An easier way to invest in long term bonds is through an Exchange traded Fund. For U.S. bonds I suggest the ETF that trades under the symbol TLT and for Canadian long-term bonds the iShares ETF symbol is XLB on the Toronto stock exchange.

HISTORICAL CONTEXT OF RECENT STOCK MARKET GAINS
The S&P 500 continues to soar to new records. On the one hand, that’s great news for investors. On the other, it gives rise to doubt about the sustainability of this bull market. Is it time to sell or to buy more?
To look for answers, let’s review some historical context. My data source is year-end total annual return figures from the Stocks, Bonds, Bills, and Inflation (SBBI®) dataset. For 2024, the figure is based on the S&P 500 recent level of 6000.
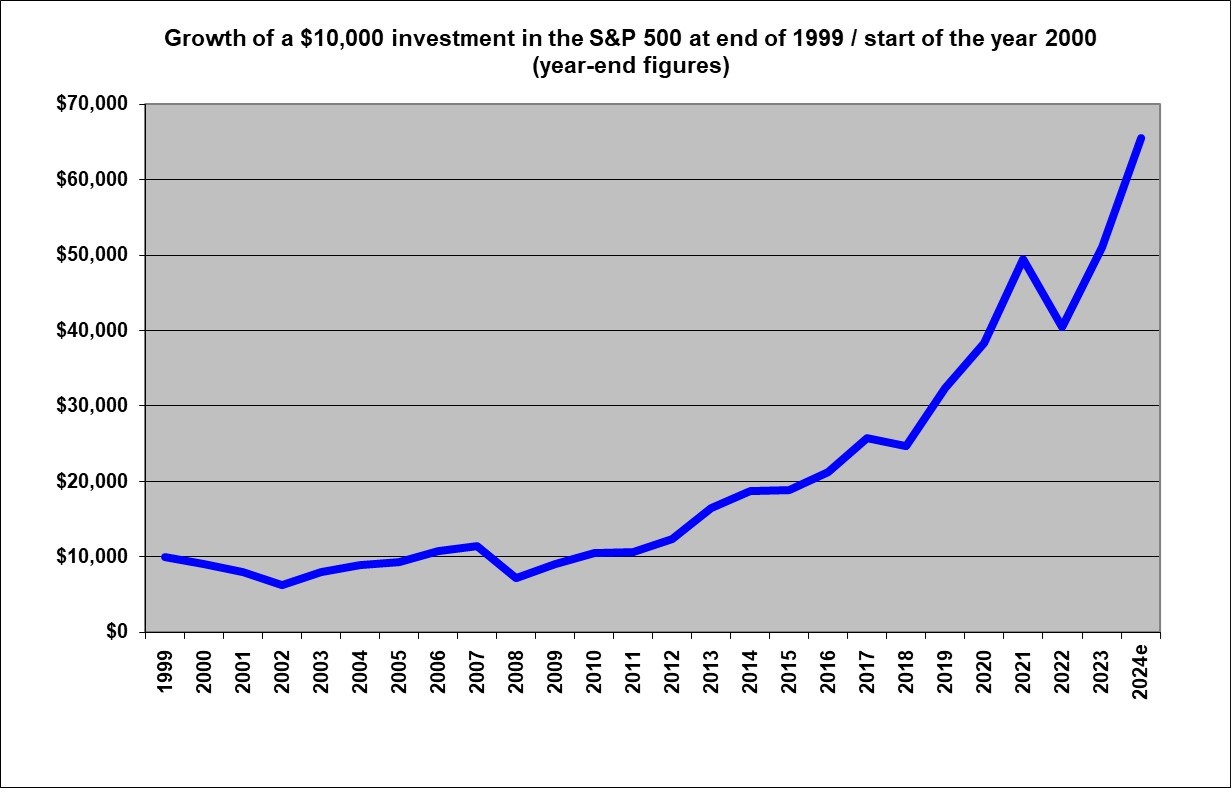
First up, here’s a graph of how a $10,000 investment in the S&P 500 at the start of the year 2000 has grown since then.

A $10,000 investment in the S&P 500 at the start of the year 2000 has grown to $65,491 (with dividends reinvested) over the past 25 years. Perhaps surprisingly, that’s a compounded annual growth rate of only 7.8%, which is lower than the long-term total return average of 11.2% over the past 75 years.
As the graph illustrates, the first nine years of that period featured a negative return and a value of $7,188 at the end of 2008. The compounded return over the subsequent 16 years has been 14.8%, which is significantly higher than the historical average return.
This graph is a reminder that the results of these last 16 years and particularly the results of the past two years are unusually high and that the market can sometimes go a decade with no return at all.
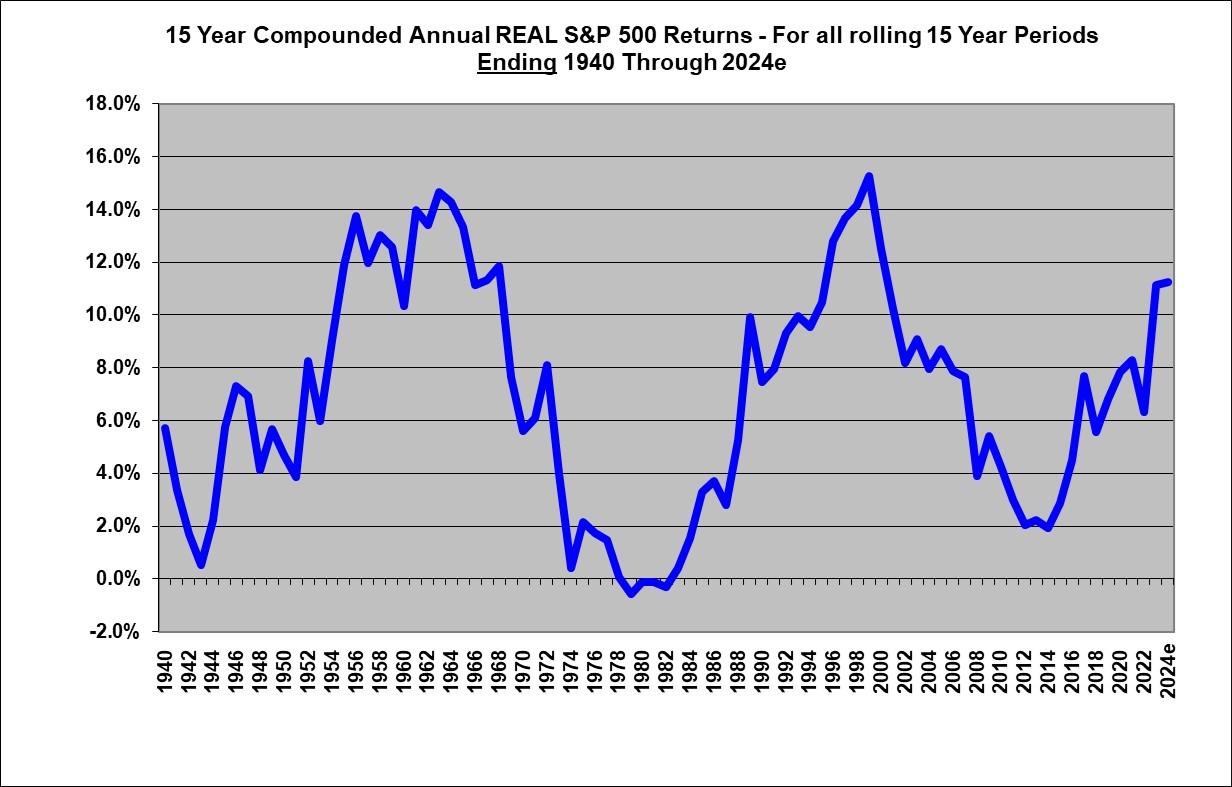
Next up is a graph showing the compound average annual returns over all rolling 15-year periods beginning with 1926-1940 and ending with 2010-2024. The 2024 figure is as of November 2024, with the S&P 500 at a level of 6000.

It’s not surprising to see that the 15-year period ending with 2024 features a compounded average annual return of 14% that is well above average. But it is perhaps both surprising and comforting to see that there have historically been quite a few 15-year periods with even higher returns.
However, the warning that I would take from this graph is that, historically, 15-year periods of very high average annual returns have ultimately been followed by 15-year periods of far lower returns – bottoming out as low as 4%. A 4% average return over 15 years turns $10,000 into about $18,000 whereas the recent 14% turns $10,0000 into $62,600. The difference between those two scenarios is stark. A continuation of the recent high returns would be nice, but it’s unwise to count on that.
The recent out-sized returns on the S&P 500 will almost surely prove to be unsustainable and will usher in a lengthy period of far lower returns at some point.
Investors should prepare for that probable eventuality by diversifying their investments.
END
InvestorsFriend Inc.
December 1, 2024