
Updated October 14, 2023
Stocks are generally considered to be more risky than bonds. This article provides the data, in graphical form, so you can see and decide for yourself if stocks have really been riskier than bonds.
For short-term investors, stocks are indeed riskier than Bonds. But for long-term investors the evidence from actual historical returns indicates that Bonds were actually riskier than stocks. But it all depends on having a proper definition of what risk means.
When it comes to long-term investors, virtually the entire investment community is focused on the wrong definition of risk. Much of what is written about risk is at best inappropriate and at worse completely wrong for a long-term investor. This is caused by an over-emphasis on short-term volatility.
For long-term investors we need to have a proper definition of risk. Financial academics and the investment community generally define risk as the short-term (annual, monthly or daily) volatility of returns from an investment. The volatility of returns is measured by variance or standard deviation.
From the perspective of a long-term investor, this definition of risk is flawed for two reasons:
- The analysis and conclusions almost always focuses on the volatility of annual (or even monthly or daily) returns. An annual focus might be appropriate for many investors, but long-term investors should be mostly concerned about risks associated with their long-term wealth level and not primarily focused on the bumps along the way.
- The analysis and conclusions are almost always based on nominal returns and ignore the erosion of purchasing power caused by inflation. For short-term investors, inflation may not a be a big concern but it has a huge impact in the long-term.
As to the second point above, it seems self evident that better conclusions will be reached using real (inflation adjusted) returns rather than nominal returns.
As to the first point above, under the short-term volatility definition of risk, stocks are considered much more risky than long-term Bonds or Treasury Bills (T-Bills). Yet, it is a fact (based on United States data since 1926) that stocks have outperformed both 20-year government Bonds and T-Bills over all but one historical calendar 30 year periods. In all but one of the 69 different 30 calendar year “rolling windows” starting from from 1926 – 1955 then 1927 – 1956 all the way through to the most recent period being 1994 – 2023, stocks have provided a higher return. But due to higher annual volatilities, stocks are considered more risky! (Admittedly, there would be more 30-year periods based on non-calendar year start and end points where long term bonds out performed stocks.)
To avoid risk (defined as annual or daily volatility) you may be advised to put substantial portions of your investments into into Bonds or T-Bills even though the historic data suggests these are in fact are almost guaranteed to under perform stocks in the long run. This kind of thinking on risk, while it may allow you to sleep better, may be hazardous indeed to your long-term wealth. (That is, if your goal is wealth maximization at some distant point like 20 or 30 years in the future, as it is for many investors, and particularly younger investors).
The following graph shows the actual annual volatility in Stock, Bond and T-Bill returns from 1926 to present. In regards to stocks, this discussion deals only with the performance of the S&P 500 large company stocks as a group; it does not deal with the risks of investing in a non-diversified portfolio of stocks. The bonds are 20-year U.S. government bonds and the investment is rolled over into a new 20 year bond each year to keep the maturity always at 20 years. The data here is for U.S. returns as published in the Ibbotson yearbook entitled, Stocks, Bonds, Bills and Inflation. For 2023 the data is as of October 14th and taken from other sources. The returns are total “real” returns including dividends and capital gains or losses adjusted downward each year by inflation. (In the depression years the real returns are adjusted upwards by deflation since “inflation” was negative.)
The actual final results at the end of 2023 will differ somewhat.
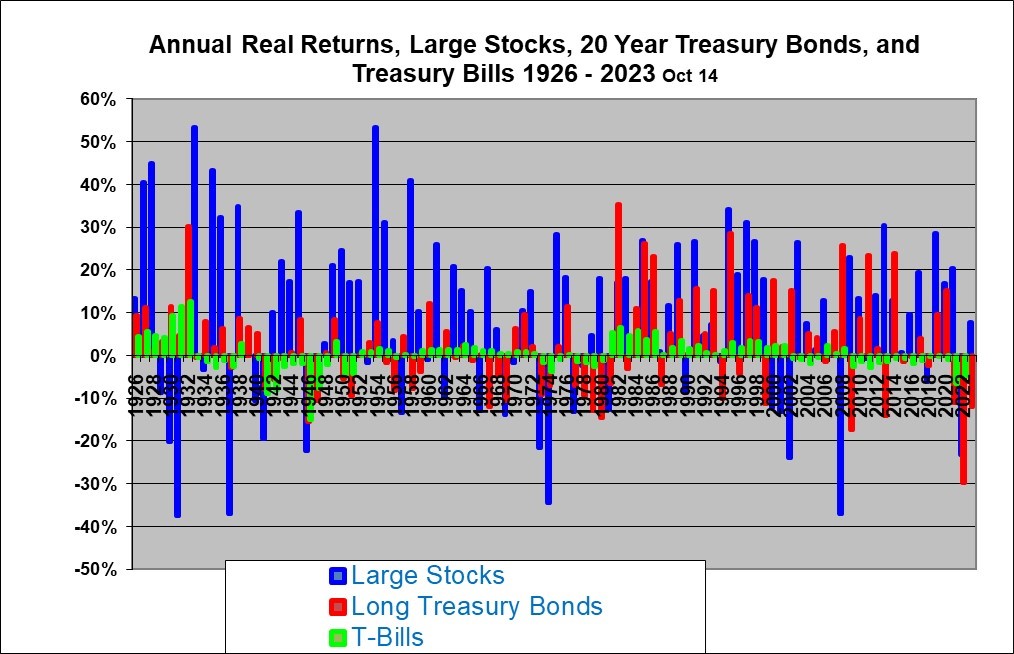
Sure enough, the stock returns (the blue bars) were clearly far more volatile on an annual basis. Long-term Treasury Bond returns (the red bars) were also quite volatile while T-Bill returns (in green) were more stable. It’s also fairly obvious that the average stock return is much higher than the average Bond return which in turn is much higher than the average T-Bill return.
On a real return basis, stocks have had calendar year losses of over 30% in four of the 96 years from 1926 to 2021, with the latest occasion being 2008. And two (1930/1931 and 1973/1974) of those occasions included an adjacent calendar year with a loss of at least 20%, meaning the total compounded loss was over 60%! Using daily data there would be more occasions when stocks have plunged at least 60% from a previous peak. That is certainly very real risk and is extremely hard to stomach. Yet we know that despite this, stocks have clearly out-performed bonds in the long run.
The age-old question for investors is whether or not the (highly probable but perhaps not certain) higher long-term average return from stocks justifies the extra risk (short-term volatility).
In judging the risk of Stocks versus Bonds, you must consider more than the annual volatility. The following illustrates this.
|
Imagine your rich uncle offers to play a coin toss game with you. If you lose he gets half your net worth. If you win he gives you an amount equal to twice your net worth. Your expected return is 0.5 * (-0.5) + 0.5 * 2.0 = 0.75 or 75%. So on average you will win 75% of your net worth but you have a 50% chance of losing half your net worth and a 50% chance of tripling your net worth. Should you play this game? Simple expected value math says yes, but most people would consider it too risky and would not play. It would be a real downer to lose half your net worth on a coin toss. (If in doubt, a male could ask his wife, she would likely have no doubts). How risky is this game? It’s very risky unless you are allowed to play several times. But imagine now if your starting net worth were $100,000 and your rich uncle said you could divide your money into ten piles and play the game 10 times, each try based on $10,000. If you win 5 times and lose 5 times, you will win $100,000 and lose $25,000 to net $75,000 ahead. If you win only 2 times and lose 8 you win $40,000 and lose $40,000 to break even. So now you can only lose if you only manage to win less than 2 coin tosses out of 10. This changes things drastically. It now seems much more sensible to play the game since you have little chance of losing. Your expected return is still the same 75% but your risk is much reduced (though not eliminated). This illustrates that in looking at any risky venture it is important to ask how many times you get to play the game. If the average return is positive, the risk declines with the number of times you get to play and if you are allowed to play many times then the risk approaches zero. Technically speaking, the standard deviation of your total return over “N” tries is equal to the standard deviation of each individual try divided by the square root of “N”. As “N” becomes large your total risk becomes very small. Similarly, the stock market becomes much less risky, if risk is defined as a lower possibility of failing to beat bond or cash returns over your full holding period, the longer you stay in. |
In regards to the stock market and the range of possible returns you simply cannot analyze your risk unless you first consider how many years that you will be investing. It is generally accepted that the typical investor is concerned very much with annual and even daily returns and has perhaps a one year time horizon. Most of the discussion you will ever see about stock market risks will focus on the one year or even daily volatility. That might be fine for the mythical average investor but it leads to completely wrong conclusions, for true long-term investors.
For a long-term investor, I would argue that the more relevant risk is clearly the risk of insufficient growth in long-term real purchasing power. Analysis which focuses on the risk of short term volatility in wealth or returns is quite simply looking at the wrong risk when it comes to the long-term investor.
will outperform even in a 30 year time horizon.
You don’t have to agree with my conclusions. You can also study the graphs above and draw your own conclusions.
Self-described long-term investors need to be sure that they really have a long time horizon before they act accordingly. For many investors, there is a chance that they will need to cash out their investments early. This could be caused by illness, job loss, disability, legal problems and other reasons. But, if an investor is virtually certain that they have a very long time horizon then it certainly appears that stocks (based on a U.S. large stock index) are not riskier than bonds, in terms of achieving the highest ending portfolio value.
Risk tolerance
Most investment theory teaches that the risk versus return trade-off is a matter of personal preference. The stock market offers higher average expected returns on stocks but at the cost of higher annual volatility. To their credit, the industry encourages those with longer term time horizons to use a higher equity weighting but still advises that all investors allocate some funds to Bonds and Bills. But this really offers little guidance to investors.
My conclusion is that the risk return trade-off is more a matter of time horizon and education, rather than personal preference. If you are virtually certain that you will not require the funds prior to 20 years or more, then history teaches that stocks have not been riskier. Stocks will almost certainly return more than Bonds or Bills (based on historic data).
If investors are educated about this then most of them can become more comfortable with the daily, monthly and annual volatility of stocks safe in the knowledge that high returns in the long-term is their almost certain destiny. It’s a bit like taking a drive on a mountain road with a lot of switchbacks. If you don’t know the road, the switchbacks and back-tracking might be highly stressful (as you think you are going in the wrong direction). But if you have studied a map carefully then you can relax and the switchbacks will not bother you since you know that the road to your destination will be circuitous.
Also, those investors who are in the savings phase of their lives are not reliant on any one thirty year period but instead typically invest a certain amount each year. This reduces risk through time diversification. If in any individual 30-year holding period stocks are highly likely to beat bonds, then in a long series of 30 year holding periods it may be virtually certain that stocks will beat bonds.
See also our article on the historical returns that been achieved overall ALL of the possible 30, 15 and ten calendar year time periods since 1926. This is based on stocks (the S&P 500), Bonds (U.S. 20 year Treasury bonds, Cash (U.S. 30-day Treasury Bills). It also includes balanced portfolios drawn from those three asset classes.
END
Shawn Allen, CFA, CMA, MBA, P.Eng.
President, InvestorsFriend Inc.
Article originally created in June 2001 and last updated October 14, 2023