Stock Market Earnings Growth and Dividend Yields Determine Long Term Returns
In theory, earnings and dividends drive stock market returns in the long run.
For example, if a stock pays no dividend then the return is driven by the capital gain. If you buy a stock with a P/E of 15 and sell it ten years later at the same P/E of 15, then your Price rise will be exactly proportional to the earnings rise. If the earnings rise by 10% per year, then your return, in this zero dividend case, will be exactly 10% per year. Again this assumes that the P/E remained constant.
If the above stock pays a 3% dividend yield then your return will equal the earnings growth plus the dividend. In this case a 7% annual earnings growth plus the 3% dividend will yield a 10% annual compounded return.
But has this really been true historically? Have stock market returns not out-paced the earnings growth plus dividends? (Certainly they have in many years, but what about over the long term?)
Over short periods of time, stock market average returns clearly do not equal the average earnings growth plus dividend. But over most 30 year periods the theoretical relationship has proven to be approximately correct as the following graph shows.
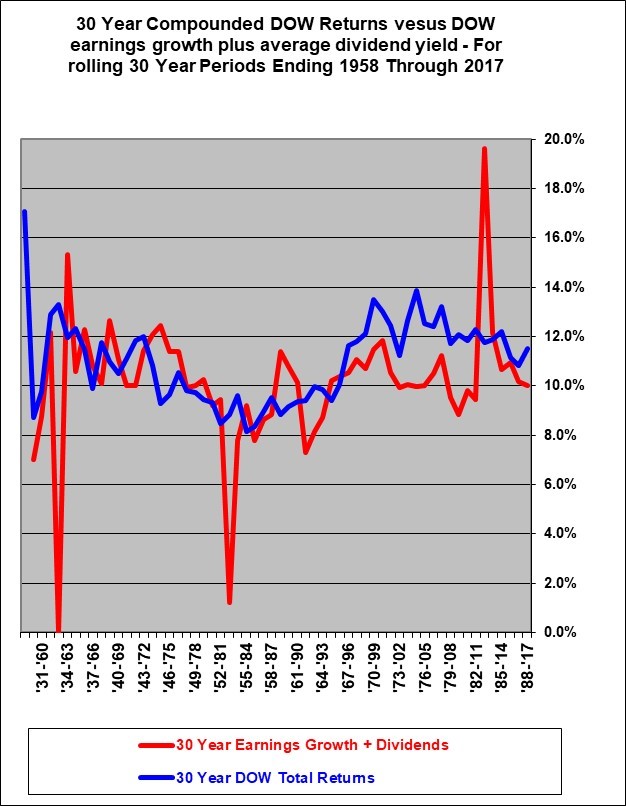
In the above graph, the earnings growth plus dividends (the red line) is quite choppy due to certain years when earnings drop close to zero. The same data is shown below on a smoothed basis which perhaps better illustrates the trend and relationship.
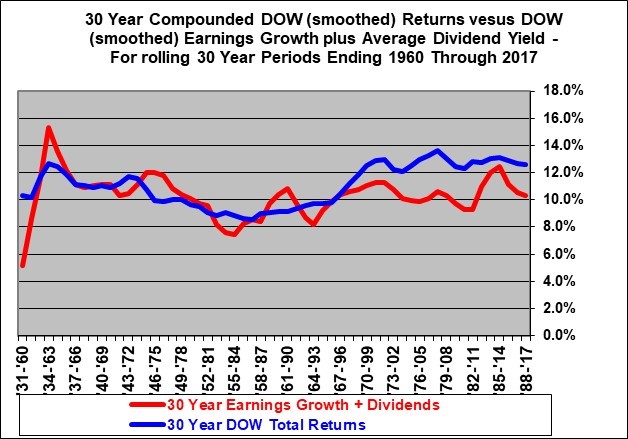
The blue line shows average compounded total returns (capital gains plus dividends) on the Dow Jones Industrial Average (“DOW”) for all rolling 30 year holding periods that ended in years 1960 through 2017. The Dow total Return is smoothed by averaging the level of the DOW total return index over 3 years at the beginning and end points in order to minimize the impact of short term market changes, since this is a long term analysis.
The red line shows the compounded average DOW earnings growth over each 30-year period plus the compounded average dividend yield. The DOW earnings growth was also smoothed by taking the average of 3 years at each end point. This smoothing is necessary in order to prevent distortion caused by temporary large dips in earnings caused by one-time write-offs such as occurred in 1981.
The two lines track each other relatively closely. The earnings growth plus dividend yield drives your total return over long periods of time.
However, in all the 30 year periods ending from 1998 through 2017, the returns to shareholders over 30 year periods remained consistently above the earnings plus dividend line. This was driven by an increase in the P/E ratios from the very low levels from 1969 and particularly in the 1970’s.
IMPLICATIONS LOOKING FORWARD:
Average stock market returns over the long term should be about equal to the growth in earnings plus the dividend yield. Currently the DOW dividend yield is about 2%. And, most economists predict that the long run rate of growth in North America will be about 5% being about 2% for inflation and about 3% for real growth. If earnings grow at about 5% and the dividend is about 2% then the expected return on stocks should be about 7%.
But deviations from that 7% can occur when the P/E ratio changes materially. Significantly higher P/E levels occurred starting in 1991. Therefore in the 30 year periods ending 2020 and later we should expect to see that the DOW returns track closer to the DOW earnings plus dividend line.
Expecting any more than about a 7% long-term average return on stocks seems unrealistic.
This 7% is well below the historical average since 1930. This is because we are in an era of low inflation and relatively low real growth and low nominal growth. Nominal growth is the actual measured growth in dollars, the real growth is lower and deducts the impact of inflation.
OBSERVATION:
Any expectations that the markets will return 10% or more in the long-term are unrealistic. Virtually no economist would predict that average long-term corporate earnings will rise by the 8% annual rates that a 10% return implicitly requires – given a 2% dividend yield.
It is tempting to suggest that the graph indicates that the DOW return is going to have to decline because it has gotten ahead of the earnings growth. However, keep in mind that the these lines are 30 year compounded returns and they are very much affected both by today’s DOW level and DOW earnings and equally affected by the starting points for the DOW level and earnings. Actually, both lines will have to decline markedly to eventually show a 30-year rolling return in the range of 7% for 30-year periods that started now or in the past few years. This assumes we remain in a low inflation environment.
Another, perhaps more clear, way to look at this is to graph the growth in the DOW index versus the DOW earnings
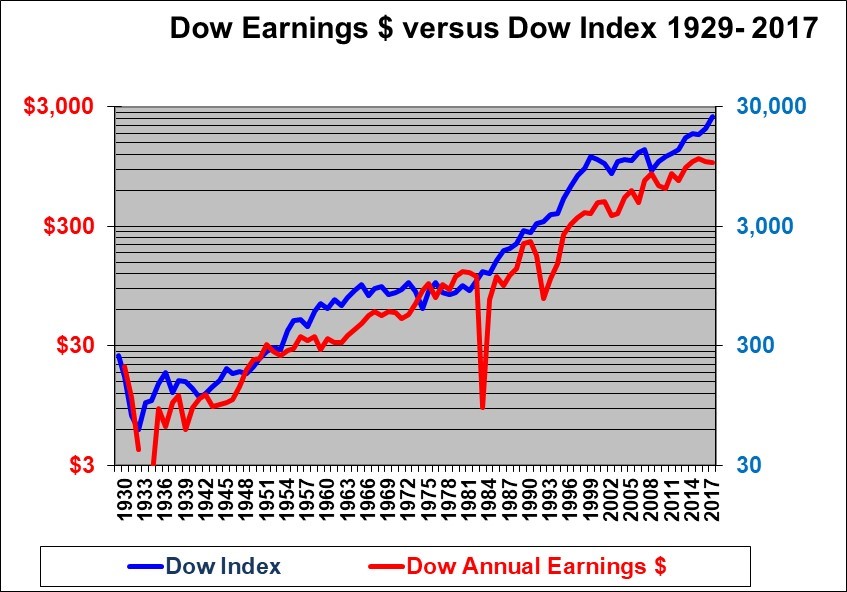
This chart shows that the rise in the DOW index is roughly parallel to the rise in the annual DOW earnings. In the 20 years prior to 2000 the (blue) DOW index certainly rose faster than the (red) DOW earnings (the P/E ratio increased). With the market crashes of the early 2000’s and around 2008, the Down index dipped down to the Dow Earnings line as the P/E. From 2009 through 2017, the Dow Index has risen much faster than the DOW earnings as the P/E increased substantially
The DOW P/E is now about 22. This is higher than the historical average level of about 15.8 (The average is actually 17.8, but is 15.8 after excluding three high outlier values that were caused by abnormally low earnings). In the longer run the DOW earnings will continue to rise as will the Dow index. But in the shorter term the DOW could certainly fall or at least rise slower than earnings as the P/E declines with higher interest rates.
First written September 28, 2002 (Last updated January 20, 2018)
Shawn Allen, CFA, CMA, MBA, P.Eng.
President
InvestorsFriend Inc.