
Dow Jones Industrial Average Valuation Analysis
This page (which draws on Warren Buffett’s teachings1) provides:
- The Dow Jones Industrial Average P/E ratio (based on trailing and forward earnings)
- The expected next-10-year average return per year from the Dow Jones industrial Average based on earnings growth and ending P/E Assumptions
- Earnings on the Dow Jones Industrial Average (GAAP and forward earnings)
- Dividend yield on the Dow Jones Industrial Average
- A link to the current P/E, earnings and dividend information on the the Dow Jones web site
- Calculations of the fair value of the Dow Jones Industrial Average based on several scenarios
- Complete and transparent data on exactly how our analysis has performed in the 18 occasions over 15 years that we have now provided this analysis.
The overall conclusion is that a fair level for the Dow would be 19,297 (as a point estimate) and that at its current level (as of April 16, 2017) of 20,453 the Dow Jones Industrial Average is about 6% over-valued which is not much above fairly valued.
Mathematically, the Fair Value of the Dow Jones Industrial Average depends on (only) four things: i) the return that investors require, ii) the current earnings and dividend level, iii) the expected growth rate in earnings and dividends, and iv) the expected P/E ratio at which it could be sold at the end of a reasonable holding period of say 10 years.
This article provides a range of values depending on the scenario chosen.
This analysis is for the DOW as of April 16, 2017. However, the calculated fair value of the Dow Jones Industrial Average (DJIA) is not affected by the precise date of the analysis and our fair value estimates will not change before the next set of quarterly earnings numbers becomes available for the DJIA. And even then, the fair value is not likely to change much.
To be notified when we next update this article, simply join the list for our (approximately) monthly free investment newsletter. If you don’t find our newsletter valuable, every issue indicates how to get off our list.
A quick indication of whether or not the Dow Jones Industrial Average is fairly valued is to look at its P/E ratio. At this time the P/E ratio (based on actual reported earnings in the past year) of the DJIA index is 20.0. This is somewhat unattractively high compared to the historical average of about 16. Therefore the quick indication is that the DJIA index was somewhat over-valued as at April 16, 2017 at 20,453. This article explores the fair value of the DJIA in much more detail below.
Importantly, an analysis of the fair value of the Dow Jones Industrial Average (DJIA) will not provide a short-term prediction of market direction but it should provide a rough indicator of the fair value of the DJIA and a long-term prediction of the expected average annual return from investing in the DJIA at this time.
The attractiveness of the current DJIA level can be judged by looking at the current level of its earnings and dividends, making a reasonable forecast of the future rate of earnings and dividend growth and by considering the minimum expected return required by investors. Analysts often apply this valuation technique to individual stocks.
It is actually far easier or more logical to apply these calculations to a stock index since an index constitutes a portfolio. A portfolio automatically eliminates much (and usually most) of the random noise of unexpected events at individual companies through diversification. Still, many challenges remain in applying this analysis and therefore its results while providing some indication for the long-term can offer no real insight for the short-term. A broad index like the DJIA remains vulnerable to changes in interest rates and to uncertain growth (or shrinkage) in the economy but is usually largely insulated from the numerous random events that can impact an individual stock.
Current and Historical Dow Jones Industrial Average Earnings and P/E Ratio
What is the Earnings and P/E ratio of the Dow Jones Industrial Average right now? (April 16, 2017 with the index at 20,453)
Current and historical data from the Dow Jones company are as follows:
Note: the data in the following table, including the historical earnings and P/E ratios, is reasonably accurate but should not be taken as exact since I was unable to find an ideal data source for the DOW’s historical earnings. This data was derived from data on the Dow Jones web site at various historical points in time, but that data was subject to later updates. For example, trailing earnings reported early in a new year would not reflect the final GAAP earnings for the prior year.
| DJIA Earnings Type | Annual Earnings on Dow Industrials | P/E Ratio at DOW 20,453 | Earnings Yield (1/(P/E)) |
| Actual latest year (trailing four quarters) GAAP earnings | $1017 | 20.1 | 5.0% |
| Forecast forward GAAP earnings for the next year (next four quarters) | $1196 | 17.0 | 5.9% |
| For Comparison here are the DJIA earnings and closing index level in prior years: | Annual Earnings on Dow Industrials (Typically based on Q3 trailing earnings) | Historical GAAP P/E | Historical Earnings Yield |
| 2016 GAAP Earnings at 19,763 | $1017 | 19.4 | 5.1% |
| 2015 GAAP Earnings at 17,425 | $1040 | 16.8 | 6.0% |
| 2014 GAAP Earnings at 17,823 | $1110 | 16.1 | 6.2% |
| 2013 GAAP Earnings at 16,577 | $1045 | 15.9 | 6.3% |
| 2012 GAAP Earnings at 13,104 | $925 | 14.2 | 7.1% |
| 2011 GAAP Earnings at 12,218 | $724 | 17.9 | 5.6% |
| 2010 GAAP Earnings at 11,578 | $831 | 13.9 | 7.2% |
| 2009 GAAP Earnings at 10,428 | $624 | 16.7 | 6.0% |
| 2008 GAAP Earnings at 8,776 | $661 | 13.3 | 7.5% |
| 2007 GAAP Earnings at 13,265 | $831 | 16.0 | 6.3% |
| 2006 GAAP Earnings at 12,463 | $720 | 17.3 | 5.8% |
| 2005 GAAP Earnings at10,718 | $476 | 22.5 | 4.4% |
| 2004 GAAP Earnings at 10,783 | $592 | 18.2 | 5.6% |
Note that our historical DOW earnings data were mostly derived from Dow data sheets from December each year or early in each new year which earnings were subject to updating based on Q4 earnings and so should not be taken to be the precise calendar year earnings.
Note that the forecast calls for the Dow Jones Industrial Average earnings to rise 18% in the next year! Generally such forecasts are optimistic.
Normalized DOW Earnings
In order to calculate a fair value of the Dow Jones Industrial Average, it is necessary to start with its current trailing earnings level and to then consider whether this current earnings level is reasonably “representative” of “normal” expected economic conditions and has not been materially affected upwards or downwards by usual items.
The following graph provides additional insight into the representative or normalized level of the DJIA earnings.
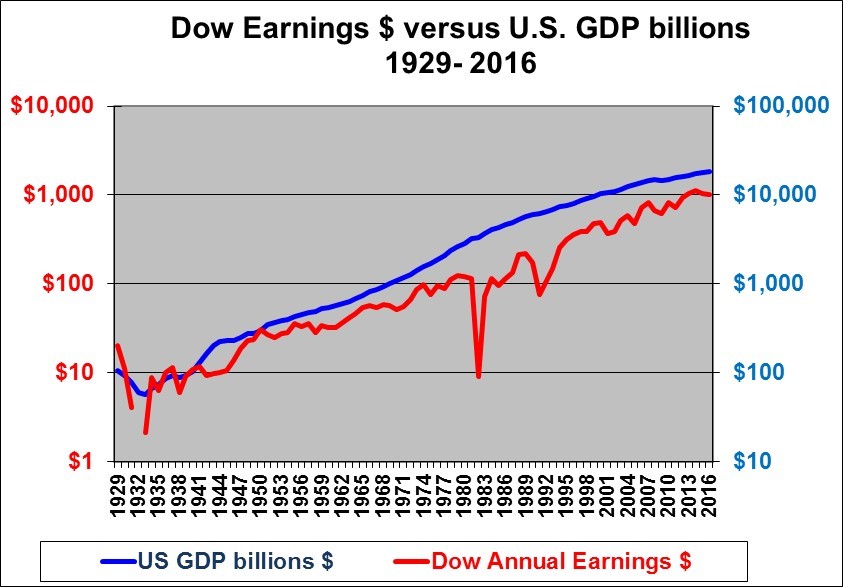
Note that we use a logarithmic scale on this chart. Logarithmic scales should always be used for data that grows over time when the time period is more than about 30 years because otherwise the lines will rise up exponentially. A straight line on a logarithmic chart represents a constant percentage per year growth. Note also, that the right and left hand scales are consistent, both rise 10,000 fold.
The above chart shows that the annual earnings on the DOW have trended up with the U.S. GDP although at a slightly lower rate than GDP since the early 1930’s and with substantial volatility around the trend. The DOW earnings in 2016 are running at a somewhat higher percentage of GDP than in more recent decades. Possibly this is explained by the fact that the DOW companies are international companies and/or by the changing composition of the DOW companies. With slightly negative earnings growth in the past few years, it may be that the 2016 earnings was somewhat below the trend line.
The next chart presents the same data but starting in 1986 so that we can more closely examine the graph over more recent years.
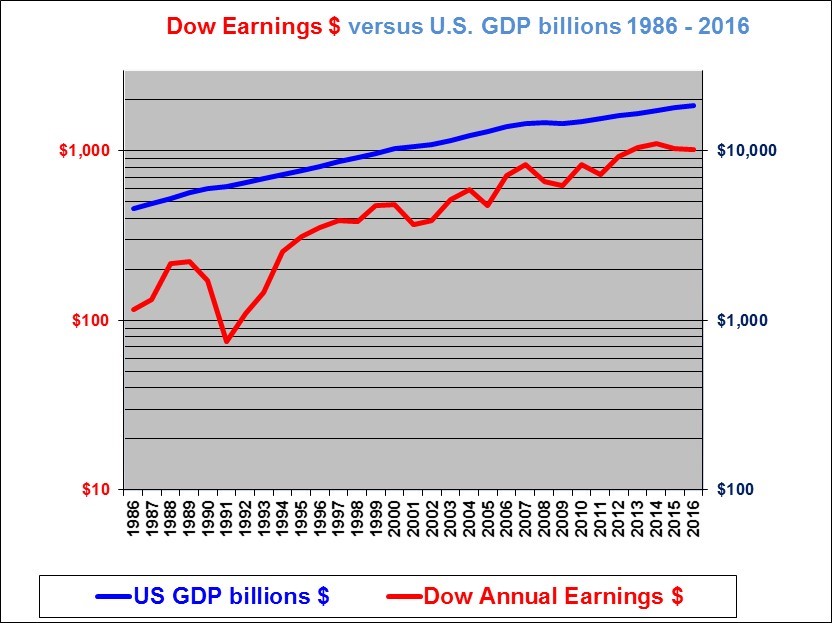
Note that the GDP figures here are in nominal dollars, to be consistent with the earnings on the Dow, whereas most reports of GDP growth refer to real, inflation adjusted dollars.
This chart shows that while U.S. GDP rose fairly steadily since 1986, the DOW earnings growth rose faster but in an irregular fashion dipping with recessions. Based on this graph, the earnings of 2016 may be slightly below the trend line.
Given that the Dow earnings in 2016 appear to be somewhat below the trend line and given that, as noted above, the forecast is for earnings growth of 18% in the next year, we will use the average of the 2016 earnings and the forecast 2017 earnings as our normalized or on trend level for 2016. This amounts to $1106. On that basis the current P/E level is 18.5.
Valuation Analysis
The Dow Jones Industrial Average represents a portfolio of 30 stocks. For each $20,453 (the current index value) purchased, the underlying companies in the portfolio earned, on a normalised GAAP basis, $1,106 in the past reported four quarters and currently pay a dividend of $506 per year.
When we buy the Dow Jones Industrial Average index, we can therefore think of it as being an investment or “stock” or (better yet) “business”, that (as of April 16, 2017) costs $20,453 per share and currently earns $1,106 per year and pays a dividend of $506 per year or 2.47%. It is worth thinking about whether or not this “stock” is a good investment at or around its recent level of $20,453.
We know that the Dow Jones Industrial Average index was at 20,453 on April 16, 2017. We can estimate what the DJIA “should” have been trading at (or is worth) based on the value of its current earnings and dividends and the projected growth in those earnings and dividends. This intrinsic value approach calculates the present value of the cash dividends for a ten year period and assuming that the index is sold for cash at a projected future P/E.
In addition to the beginning earnings and dividend level, three additional factors are required to calculate the fair value at which the DJIA should be trading at. These are, 1. The forecast average annual growth rate in earnings and dividends over the next (say) ten years. 2. The forecast P/E ratio at which the DJIA index will be trading in ten years time (an assumed ten year holding period for analysis purposes). 3. The estimated minimum expected rate of return required by investors. (This required return is used to discount future cash received amounts to today’s present value).
Warren Buffett has argued that over the longer term, the Dow Jones Industrial Average portfolio average earnings should grow at a rate close to the growth rate of the U.S. economy in nominal (not adjusted down to remove inflation) terms. I believe a prudent estimate for this growth rate is normally 4% to 6% and I would normally focus on 5%. This 5% can also be thought of as 3% real GDP growth and 2% for inflation). Currently there is a lot of uncertainty as to both expected real GDP growth and the inflation level. Some expect deflation while others expect inflation. Overall a 5% earnings growth assumption does not seem unreasonable but is certainly subject to much uncertainty.
The average P/E for the Dow Jones Industrial average since 1929 has been 15.7 (Uses year-end data and excludes years when the P/E was abnormally high due to near-zero earnings and not due to optimism (The 1933 P/E of 47.3, 1982 P/E of 114.4,and the 1991 P/E of 64.3 are all excluded as outliers, which lowers our historical P/E estimate). The historical median P/E was 16.1.
However, the Justifiable P/E changes with earnings expectations and the market’s required return on equities.
The linked article states “I have conservatively calculated that the current Justifiable P/E is about 14.3 assuming that with today’s low interest rates investors require about a 7% expected return and assuming that competition will drive available returns down to the required 7% level.” The article also indicates that if companies can deliver in perpetuity an 8% ROE when investors only require 7% (perhaps due to a lack of corporate competition) then a P/E of 21.4 can be justified but we considered that to violate equilibrium conditions. However, it does appear that companies have been able to earn ROEs higher than the required return and to do so consistently which does justify a higher P/E. The long-run P/E range used in our table below is 15 to 19. I have focused on a P/E level of 17, just above the long run average of 16. Given today’s low interest rates 17 may be conservative. An argument could be made to assume a higher P/E such as 19.
I would estimate that a minimum (pre-tax) expected return required by stock investors (given today’s historically low interest rates) is in the range of 6% to 7%. The higher return required by investors then the lower the price or level that investors should be willing to pay for the index today, all else being equal.
The following table calculates the value that the Dow Jones Industrial Average will be at in ten years given various forecasts for the earnings growth and given various scenarios for the forecast P/E ratio that will apply at that time. The table then shows the fair or present value that we should be willing to pay today for the cash flows that would result from receiving each of the ten years of dividends plus the assumed cash from selling the index in ten years time (at the amount in the column titled “Resulting DJIA in 10 years”). The cash flows are converted to a “present value” calculated using the amount in the “Required Return” column. The present value is calculated based on various scenarios (as shown) for the required return or discount rate applied to each earnings growth and ending P/E scenario.
| Earnings | Dividend | Growth | Terminal P/E | Resulting DJIA in 10 years | Required Return | DJIA Fair Value Today | Implied Fair P/E today | Return per Year at 20,453 |
| 1,106 | 506 | 3% | 15 | 22,296 | 6% | 16,785 | 15.2 | 3.7% |
| 1,106 | 506 | 3% | 17 | 25,268 | 6% | 18,445 | 16.7 | 4.8% |
| 1,106 | 506 | 3% | 19 | 28,241 | 6% | 20,105 | 18.2 | 5.8% |
| 1,106 | 506 | 3% | 15 | 22,296 | 7% | 15,462 | 14.0 | 3.7% |
| 1,106 | 506 | 3% | 17 | 25,268 | 7% | 16,973 | 15.3 | 4.8% |
| 1,106 | 506 | 3% | 19 | 28,241 | 7% | 18,484 | 16.7 | 5.8% |
| 1,106 | 506 | 4% | 15 | 24,557 | 6% | 18,276 | 16.5 | 4.7% |
| 1,106 | 506 | 4% | 17 | 27,832 | 6% | 20,105 | 18.2 | 5.8% |
| 1,106 | 506 | 4% | 19 | 31,106 | 6% | 21,933 | 19.8 | 6.8% |
| 1,106 | 506 | 4% | 15 | 24,557 | 7% | 16,825 | 15.2 | 4.7% |
| 1,106 | 506 | 4% | 17 | 27,832 | 7% | 18,490 | 16.7 | 5.8% |
| 1,106 | 506 | 4% | 19 | 31,106 | 7% | 20,154 | 18.2 | 6.8% |
| 1,106 | 506 | 5% | 15 | 27,023 | 6% | 19,894 | 18.0 | 5.7% |
| 1,106 | 506 | 5% | 17 | 30,626 | 6% | 21,906 | 19.8 | 6.8% |
| 1,106 | 506 | 5% | 19 | 34,230 | 6% | 23,918 | 21.6 | 7.9% |
| 1,106 | 506 | 5% | 15 | 27,023 | 7% | 18,305 | 16.6 | 5.7% |
| 1,106 | 506 | 5% | 17 | 30,626 | 7% | 20,137 | 18.2 | 6.8% |
| 1,106 | 506 | 5% | 19 | 34,230 | 7% | 21,969 | 19.9 | 7.9% |
Valuation Conclusions and Observations
By changing the expected earnings growth rate, the return required by investors and the assumed P/E ratio that will apply in ten years I can calculate that today’s DJIA index should be anywhere from 16,785 (we would earn an average a return of 3.7% per year, buying today at 20,453 under these assumptions) to 23,918 (we would expect to earn an average 7.9% per year, buying today at 20,453 under those assumptions). A reasonable scenario may be average of the two highlighted rows with 4% earnings growth per year, a 6.5% (average of 6% and 7% in the two rows) required rate of return and a final P/E ratio of 17 in ten years and a fair DOW level of 19,297 and an expected return of 5.8% per year on average if bought at today’s 20,453. However, other scenarios are certainly plausible as well.
Note however that all estimates assume the $1,106 actual trailing GAAP earnings is the current representative normalized earnings on the DOW.
Since the Dow Jones Industrial Average is currently at 20,453, I conclude that it is likely about 6% overvalued as a point estimate.The table illustrates quite a wide range for a reasonable fair value of the Dow Jones Industrial Average.
Some investors might not admit to being happy with a 6.5% expected long-term return from stocks, but 7% seems highly attractive compared to a current 10 year U.S. government bond yield of just 2.3%.
Note also that the Price to book ratio of the Dow Jones Industrial Average is 3.56. The DJIA companies have therefore achieved a return on ending equity of about 17.5% in the past year based on ROE = P/B divided by P/E.
Another way to calculate the expected return on the Dow Jones Industrial Average index is by using the dividend growth model. This assumes that the dividend will grow at the rate of the ROE on retained earnings times the proportion of earnings that are retained. The dividend payout ratio calculated from the dividend and earnings in the table above is $506/$1106 = 46%. That means the earnings retention ratio is 54%. If the DJIA companies could continue to make the same ROE of 17.5% on their existing equity plus on retained earnings then the dividend would grow at 54% of that or 9.4% annually, assuming the same earnings pay-out ratio. Adding the current dividend yield of 2.5% would then suggest an expected return of about 11.9%, assuming the P/E was unchanged. However, an 17.5% ROE on future as well as past retained earnings seems quite optimistic. If we use a 10% ROE on new investments (of future retained earnings) the expected return on this basis is about 7.9% (5.4% plus 2.5%). And this assumes that the P/E remains constant at 18.5.
The overall conclusion is that a fair level for the Dow would be 19,297 (as a point estimate) and that at its current level (as of April 16, 2017) of 20,453 the Dow Jones Industrial Average is about 6% over-valued which is not much above fairly valued.
It is impossible to predict where the DJIA will go in the next year. But it is relatively easy to calculate whether or not it is currently significantly under- or over-valued based on reasonable growth expectations and a reasonable projection for the P/E ratio and a reasonable assessment of investors’ minimum required rate of return. Caution is warranted because the DJIA can sometimes spend years in an over-valued or an under-valued-state. But ultimately, as we saw in the early 2000’s, and in 2008, valuation does correct itself, and often over-corrects as well.
You can easily invest in the Dow Jones Industrial Average Index index by buying the ticker symbol DIA on New York, the SPDR Dow Jones Industrial Average Exchange Traded Fund.
Readers can also see our similar analysis of the S&P 500 index and of the Toronto Stock Exchange Index
Shawn C. Allen, CFA, CMA, MBA, P.Eng.
President, InvestorsFriend inc.
Last updated April 16, 2017
This is an update of an analysis I first did of the DJIA dated February 8, 2002 Click to check out what the analysis was indicating way back then. The table below shows how this analysis has performed in the past. The assessment of past performance assumes that today’s level of the DOW at 20,453 at April 16, 2017 is a fair value of the DOW today. The results are mixed. Our fair value of the DOW estimates in the earlier years were too optimistic. This analysis did not “warn” that the market was over-valued entering 2008. In recent years it appears to be working better perhaps due to enhancements to our analysis and to better consideration of whether the beginning earnings needed to be normalized or not and due to a correction to the long-run average P/E ratio. Since late 2008, this analysis has in most cases suggested that the DOW was undervalued and in fact returns since each of the analysis dates beginning in the Fall of 2008 to late 2015 have been quite good.
| Date of prior calculations | DJIA Level | Fair Value we Calculated | We Indicated Market appears: | Average Capital Gain Per Year (Annualized) | Apparent Performance as of April 16, 2017 with Index at 20,453 |
| December 12, 2015 | 17,265 | 17,546 | about fair-valued | 13.4% | It appears we too cautious |
| March 31, 2014 | 16,458 | 17,249 | about fair-valued | 7.4% | It appears we were correct |
| May 18, 2013 | 15,354 | 14,853 | about fair-valued | 7.6% | It appears we were correct |
| January 12, 2013 | 13,488 | 14,165 | about fair-valued | 10.3% | It appears we were correct |
| March 4, 2012 | 12,978 | 15,072 | under-valued | 9.3% | It appears we were correct |
| March 6, 2011 | 12,170 | 11,997 | about fair-valued | 8.9% | It appears we were correct |
| September 11, 2010 | 10,463 | 11,779 | under-valued | 10.7% | It appears we were correct |
| May 29, 2010 | 10,137 | 10,975 | under-valued | 10.7% | It appears we were correct |
| October 11, 2009 | 9,865 | 11,026 | under-valued | 10.2% | It appears we were correct |
| April 4, 2009 | 8,018 | 9,146 | under-valued | 12.4% | It appears we were correct |
| December 6, 2008 | 8,635 | 10,317 | under-valued | 10.9% | It appears we were correct |
| November 6, 2008 | 8,696 | 10,506 | under-valued | 10.7% | It appears we were correct |
| June 8, 2008 | 12,182 | 12,931 | under-valued | 6.0% | We now appear too optimistic as the $803 earnings from June 2008 declined before finally recovering. In hindsight, we should have considered whether earnings were above the trend line. The trend line was not part of the analysis at that time. |
| September 8, 2007 | 13,113 | 13,214 | about fair-valued | 4.7% | We were too optimistic as we did not project a sharp earnings decline. |
| September 15, 2006 | 12,446 | 12,009 | about fair-valued | 4.8% | We were too optimistic, the earnings, then at $720 did not grow as expected. |
| May 31, 2005 | 10,467 | 10,912 | about fair-valued | 5.8% | We were too optimistic, the earnings, then at $661 did not grow as expected. |
| November 30, 2004 | 10,428 | 10,716 | about fair-valued | 5.6% | We were too optimistic, the earnings did not grow as expected. |
| February 8, 2002 | 9,744 | 9,820 | about fair-valued | 5.0% | See below |
Regarding the earliest estimate just above. In hind-sight, and based on the 15 years that have now passed we were moderately optimistic. Earnings, then at $485 did not grow at the then expected 7% (but they have grown at 5.6% in the 15 years since then) and our assumed terminal P/E at 18 subsequently seemed somewhat high although as of today it does not look too high. But we did recognize that our fair value of 9,820 in 2002 might be too high and we stated at that time: “Investors should be sobered by the fact that if investors require a 9% rate of return and if the earnings only grow at 5% (say 3% GDP plus 2% inflation) and if the DOW commands a P/E of only 15 in ten years then the fair value of the DOW is calculated as only 5898. So conservative but not really gloomy forecasts of earnings, required return level, and P/E result in a fair value of the DOW at only 5898. Gulp!”
1. See Warren Buffett in Fortune Magazine, November 22, 1999, and his updated article of December 10, 2001. The same linking of stock index growth to GDP (or GNP) was made in Buffett’s October 9, 1969 letter to his partners.