
What Long-Term Return Should We Expect On large-capitalization Stock Market Indexes?
The answer is, in the long-term Stocks will return a percentage that is roughly equal to (actually slightly lower than) the Rate of Nominal GDP GrowthPlus the average Dividend Yield. This is demonstrated below with logic and graphs of the historic data.
Investors putting their money into stocks need to understand what long-term average return they can reasonably expect.
This article shows that a reasonable estimate for the average long-term compounded stock market returns on the overall market index is roughly in the range of 7%. And that is before deducting trading and investment management costs. This is based on U.S. data, but would also apply very similarly to Canada.
Many analysts forecast the long-term average return based strictly on historic returns. For example, the Dow Jones Industrial Average Total Return (including reinvested dividends), has returned, as ofthe end of, 2012, a yearly average of about 11.0% per year since 1930. On a compounded basis this is equivalent to a steady return of9.1% per year compounded. (Compounded average returns are lower than average returns due to the impact of volatility). So, some investors might predict a future 9%long term average return. Other investors observe that stock indexes have made meager returns of less than 3% per year for the S&P 500 from 2000 through 2012 since the year 2000 and might therefore predict something like 3% going forward.
A 9% per year as a compounded long-term average is a return level that most investors would be happy to achieve in 2013 and as a long-term future return. And the highly volatile and low average 3% total return from the S&P 500 realized from 2000 through 2012 would not entice most people to invest. But what return should we expect from stocks going forward?
Some analysts (most notably Warren Buffett in Fortune Magazine November 22, 19991) argue that future long-term stock market returns can be estimated based on GDP growth and the dividend yield.
The math is simple, according to Warren Buffett1 and others, we can roughly forecast the long-term expected return from major large-capitalization stock market indexes as:
Expected real GDP Growth + Expected Inflation + Expected Dividend Yield
The advantage of this simple method is that long-term forecasts of the three variables are available.
Today, a reasonable estimate of long-term expected large-capitalization stock market returns according to this formula might be:
3% for real GDP growth + 2.0% for inflation + 2.0% for dividend yield = 7.0% long-term total return on stocks.
Equivalently; 5.0% for nominal GDP growth + 2.0% for dividend yield = 7.0% long-term total return on stocks.
Many of us might describe a 7.0% long-term average compounded stock market return as being somewhat disappointing. And it is particularly disappointing when we consider that we need to deduct trading and management fees of about 1% to 2%,and we also need to deduct something for income taxes.
You can argue about the numbers to assume in the above formula. This is especially so today when GDP growth has been low and where some fear deflation and others fear hyper-inflation. But most long-term forecasts for these variables would total something close to our 7.0% figure.However, you can plug your own estimates into the simple formula if desired.
But are long-term stock market returns really related to GDP, inflation and the dividend yield in this way? Certainly, short-term stock market bear little relationship to this formula. But what about the long-term? What does history tell us?
The graph below provides the answer based on data for the Dow Jones Industrial Average, which is a large-capitalization stock index.The graph is based on rolling 30 year holding periods to simulate actual investor experience over different time periods. Each point on the graph below is the compounded average percentage gain in the Nominal GDP or the compounded average total return on the Dow Jones Industrial Average over the past 30 years.
In fact, history tells us that over most historical 30-year periods long-term stock market returns on the DOW Jones Industrial Average (the red line) were actually usually lower than the growth in GDP plus inflation plus the dividend yield.The notable exceptions are the 30 year rolling periods ending in 1999 through 2012, the DOW total return,at over 12% (the red line here), exceeded the growth in GDP plus the compounded average dividend yield (the blue line). In 1999 and 2000, the fact that the DOW returns over the previous 30 years exceeded GDP + inflation + dividend yield was due to the very high stock market valuation. In more recent years the out-performance was more likely due to a very low starting point for the DOW in the 70’s and early 80’s.
The red Dow Jones Industrial Average total returns line is “smoothed” by taking an average of three years at the beginning and end point. This eliminates some of the volatility due to sharp annual moves in the DOW and allows a better view of the underlying trend.
A 30-year rolling holding period graph is also provided based on data for the S&P 500 as compiled by Ibbotson Associates in their Large Stock Index2. The pattern was remarkably similar to the DOW graph although the total returns on the S&P 500 (red line)tracked the GDP +Dividends line more closely (particularly in recent years) than did the DOW total return.
The graph above shows that the the summation of the average nominal GDP growth over 30 years plus the average dividend on the stock market has been trending down for many years. The relationship suggests that the average return on the S&P 500 will trend down with it. Current forecasts of nominal GDP plus dividends are even lower in the 7% range and the graph suggests that the S&P 500 total return average will follow it down.
Interpreting the lines based on 30-year rolling data above can be very difficult.A more direct view of the Dow earnings (not return but earnings) versus GDP is shown below.
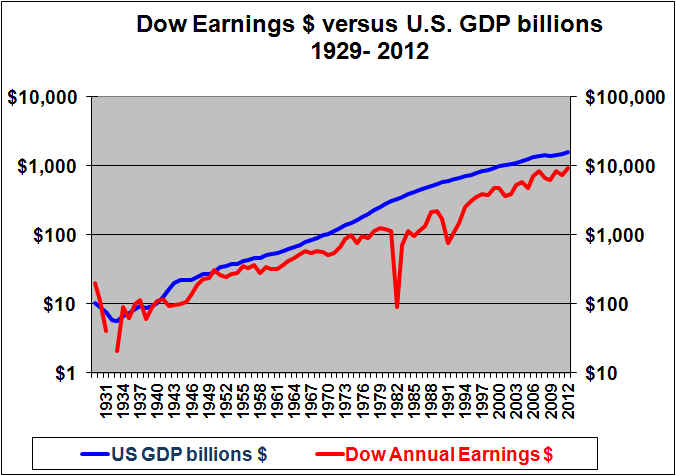
Note that the above graph has logarithmic which is the ONLY proper way to show long-term trends but which can make a large percentage change appear quite small. Also notice that the two lines on the chart use two different but consistent scales. Thescale for the Dow earnings (red line, left scale is 1/10th of the value of theGDP scale (blue line, right scale). This makes sense because the GDP is (very)roughly ten times as large as the Dow Earnings. My two scales are consistent inthat in each case the top of the scale is 10,000 times larger than the bottom. Many analysts will use a left scale that has a range of say 1 to 50, while theright scale goes from say 10 to 200, rather than 10 to 500. Such inconsistentscales are very mis-leading. I always use scales that are consistent.
This graph shows the steady growth in U.S. GDP (blue line) versus the growthin the earnings of Dow Jones Industrial index which are more volatile but whichalso rose steadily in the long-run. The slope of the earnings line is slightly lower thanthat of the GDP line. Thus, stock market earnings growth is driven by growth inGDP, in the long run, but is slightly lower. Dow Jones Industrial Average totalreturns are in turn, in the long term, of course, driven by the earnings anddividend yield on the Index.
Below I show the exact same data but this time with a linear scale:
This chart with a linear scale is not the proper way to look at the trend ofGDP or Dow earnings since 1930. (Log scales are best). However the linear scaleconfirms how DOW Jones Industrial Average Earnings have trended up with GDP overthe years. The linear scale does a better job of showing the big drop in the DOW earnings in 2008.
What Does This Imply For Future Long-Term Returns In The Market?
For 30 year periods (and for other longer periods of at least 15 years) starting today we should expect the nominal GDP plus dividendsfigure to be in the range of about 7.0% (although with huge volatility around that averagefigure in any given year). This lower-than-historic level is driven by today’s very low interestrate outlook, low inflation outlook and relatively modest real GDP growthoutlook. Due to the historical and logical relationship of large-capitalizationstock returns being no greater than the sum of nominal (after-inflation) GDP plus the dividend yields, weshould not expect large-capitalization stock returns to exceed about 7.0%. And thisis before trading and management costs and before any income taxes.
We would have to adjust our expected returns figure if we thought thattoday’s stock market values were very high or very low according to historicalnorms. The stock market as of May 25, 2013 is probably reasonably valued..
The result is that our disappointing estimate of 7.0% is not only reasonable but in fact may be biased high since actual large-capitalization total stock earnings and returns historically lags the sum of GDP growth plus the dividend yield over 30 year periods.
The average total return on the DOW and S&P 500 has been very low over the pastdozen years. But that does not mean we should expect negative ortiny returns going forward. Both the approximate 18% ten-year compounded average annual returns that we saw in the ten years ended 1998,1999 and 2000 as well as the recent very low ten-year compounded average return were abnormal. Something closer to our 7.0% is a better guess going forward.
As mentioned, I first heard this theory from Warren Buffett and the dataindeed seems to prove his theory (not a surprise). But, this relationship only holds (even approximately) over long periods such as 20 years or more. It is not meant to be a short-term indicator.
Shawn Allen, CFA, CMA, MBA, P.Eng.
InvestorsFriend Inc.
First written July 10, 2003 last updated May 25, 2013
See also our related article on what return to expect from the Dow.
1. Warren Buffett in Fortune Magazine,November 22, 1999, said:
Let’s say that GDP grows at an average 5% a year – 3% real growth, which is pretty darn good, plus 2% inflation. If GDP grows at 5%, and you don’t have some help from (declining) interest rates, the aggregate value of equities is not going to grow a whole lot more. Yes, you can add on a bit ofreturn from dividends. But with stocks selling where they are today (this was 1999), the importance of dividends to total return is way down from what it used to be. Nor can investors expect to score because companies are busyboosting their per share earnings by buying in their stock. The offset here is that the companies are just about as busy issuing new stock, both through primary offerings and those ever present stock options.
At the May 2001 Berkshire Hathaway annual meeting, Buffett again spoke of long-term returns based on 5% for GDP and he estimated the dividend yield at 1.5% at that time. And he noted that this (6.5%) return would be before the investor’s trading costs.
Warren Buffett’s Fortune article was updated December 10, 2001.
2. The Ibbotson Large Stock return figures are from theStocks, Bonds, Bills and Inflation Yearbook by Ibbotson Associates. They indicate that the “large company stock total return indexis based on the S&P Composite Index”. Since 1997, Ibbotson has obtained its datadirectly from S&P. Prior to 1997 the dividend or income return was calculated byparties other than S&P. Consult the Ibbotson Yearbook for further discussion.