
THIS IS AN EXAMPLE ANALYSIS AND IS NOW OUT OF DATE
This Sample Shows you the content of the reports and you can see there is a lot of analysis and thought that goes into our ratings.
Our analysis includes a graph of earnings per share growth and revenue per share growth. Most analysts only graph stock price growth. Our philosophy is that if a company can take care to grow its earnings per share, the stock price will tend to take care of itself. We use a logarithmic scale on graphs. Log scales are the only honest way to present this information. On a normal arithmetic scale (which almost everyone else uses) a tiny growth can be made to look like a huge growth.
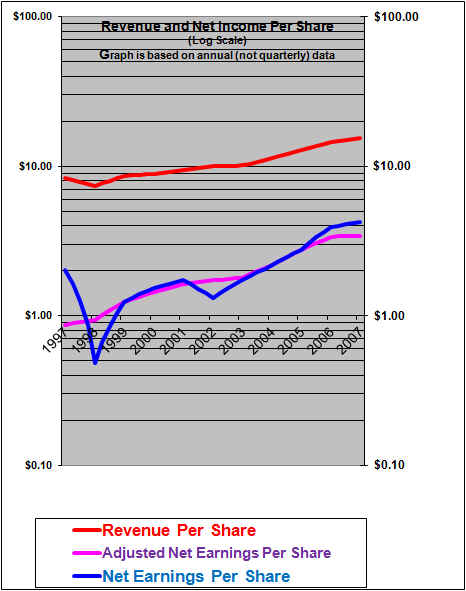
The chart of the revenue per share growth for CN (red line) shows a decline in 1998, recovery in ’99 and modest growth in the early 2000’s followed by quite strong growth since 2003. The earnings per share (adjusted for unusual items) (pink line) has grown substantially faster than revenues and notably has stalled to no growth in 2007. CN is likely facing little or no earnings growth in 2008 although management does project mid to high single digits based on its forecast of a slow-down (not recession) in 2008. Beyond 2008, it seems reasonable to assume that this well-run company with its duopoly position in Canada can continue to grow earnings per share at perhaps 7 to 10% per year. Note that the graph here is updated to 2009 while the original report had a graph that ended at 2007.
| Canadian National Railway Company (CNR, Toronto CNI, New York) | |
| RESEARCH SUMMARY | |
| Report Author(s): | InvestorsFriend Inc. Analyst(s) |
| Author(s)’ disclosure of share ownership: | Author(s) hold shares |
| Based on financials from: | Dec ’07 Y.E. |
| Last updated: | 2-Feb-08 |
| Share Price At Date of Last Update: | $51.86 |
| Currency: | $ Canadian |
| Generic Rating (This rating does not consider the circumstances of any individual investor and is therefore not a recommendation and is not Investment Advice ): | THIS IS AN EXAMPLE ONLY AND IS NOW OUT OF DATE(lower) Buy rated at $51.86 |
| DESCRIPTION OF BUSINESS: Railroad, operating coast to coast in Canada and includes Illinois Central Railway which extends the reach south to the Gulf of Mexico. | |
| SUMMARY AND RATING: The graph illustrates that this is a “great company” with strong (adjusted) earnings per share growth. ROE is very strong and overall the value ratios indicate a Buy. This management seems to be very aggressively focused on growth in shareholder value. Arguably passes all of the Buffett tenets. Very recent earnings growth has stalled to about 0%. The near-term outlook is for flat to slightly lower earnings due to the high Canadian dollar and lower forestry volumes and possible U.S. recession. Growth should resume after 2008. Significant share buy backs add support to the price. Overall we rate it a (lower) Buy due to the strong management, the earnings history, the reasonable P/E and the long-term sustainable advantage of owning tracks that likely cannot be duplicated by competitors, and the current value premiums being paid for cash generating assets, this is offset by a relatively poor outlook for the next year. | |
| RISKS: The company notes environmental and casualty liability risks. Also labour trouble is a large risk. Rising pension costs. Some regulatory and environmental risks. See annual report for more risks. | |
| INSIDER TRADING / INSIDER HOLDING: Checking insider trading from July 1, 2007 to December 10, 2007. About 7 insider exercised options and sold shares but generally continued to hold many shares so this is not considered more than a very modestly negative signal. 1 insider sold 400 shares at $54. One insider exercised options but held most of the shares and then bought 1000 when it dipped to $46. The CEO bought 21,000 shares at about $47. One director bought shares at $57 and $51. The company itself is buying back lots of shares but we take no signal from that – after all they are using shareholder money to do that. Updating from Dec 11 to Feb 1, several insider exercised options and sold around $50. Subsequent to the recent earnings release 1 insider exercised options and sold at $48.55. Overall, the insider trading / insider holding signal seems about neutral at a $52 share price. | |
| WARREN BUFFETT’s TENETS: Arguably passes all of Buffett’s tenets (see Robert Hagstrom’s book) – simple to understand (pass), good profit history (pass), reasonably favourable prospects due to strong management and low costs (pass), rational-candid-ethical management (pass), high ROE (pass), high profits on sales (pass), a reasonably low debt ratio (pass) and arguably selling at a reasonable discount to intrinsic value (marginal pass). | |
| MOST RECENT EARNINGS AND SALES TREND: Adjusted Earnings per share were unchanged in 2007 versus 2006. In Q1 2007 earnings per share dropped 5% due to disruptions of service caused by weather problems and labour problems. In Q2 2007 adjusted EPS roses 7%. In Q3 2007 adjusted EPS declined by 1%. In Q4 adjusted EPS were the same as Q4 2006. Therefore the trend had been very strong but it appears that earnings growth has now stalled. Earnings per share growth has gone to 0% due to the higher Canadian dollar and due to much lower shipments of forestry products to the U.S. – caused by the housing recession there. | |
| VALUE RATIOS: Analysed at $51.86. Price to book value ratio at 2.5 is neutral in attractiveness and mathematically reflects the high ROE and modest P/E. Price to book would be lower (more attractive) at about 1.7 if deferred taxes were removed or fully discounted as a liability. The P/E (adjusted to remove unusual gains) is 15.3 which seems somewhat attractive. Dividend yield is modest at 1.8%, but the dividend has been increasing substantially. Return On Equity (adjusted to remove gains) was quite strong at 17.2%. Sales per share have grown at an average 9.1% in the past 5 years. Adjusted EPS growth over 5 years has averaged a very strong 14.5% but was 0% in 2007. As detailed below, we calculate the intrinsic value to be $53.09 to $64.41, assuming five-year growth of 7% to (a perhaps quite optimistic) 10% and a P/E in five years of 15 to 16 respectively. This indicates an estimated Price to Value ratio of between 98% and 81% respectively. In order to return 15% annually over 5 years (to shareholders buying now at $51.86) growth would need to average 11.9% assuming a P/E of 16, such growth is quite optimistic. Overall these ratios, in isolation, indicate a Buy rating assuming growth of at least 7%. | |
| SUPPORTING RESEARCH AND ANALYSIS | |
| Symbol and Exchange: | CNR, Toronto (and CNI, New York) |
| Currency: | $ Canadian |
| Category: | Mature with moderate growth potential |
| Contact: | mark.wallace@cn.ca |
| Web-site: | www.cn.ca |
| INCOME AND PRICE / EARNINGS RATIO ANALYSIS | |
| Latest four quarters annual sales $ millions: | $7,897.0 |
| Latest four quarters annual earnings $ millions: | $2,158.0 |
| P/E ratio based on latest four quarters earnings: | 12.2 |
| Latest four quarters annual earnings, adjusted, $ millions: |
$1,725.0 |
| BASIS OR SOURCE OF ADJUSTED EARNINGS: One time gains and losses identified by management are removed for the adjusted earnings figure. | |
| Quality of Earnings Measurement and Persistence: The reported Earnings seem “real”. But, the company notes that the depreciation charges are insufficient to replace the equipment after inflation. This seems to be the case given that capital expenditures are markedly higher than the depreciation expense. Until 2005 the company was paying little cash taxes which added to earnings quality, but cash taxes appear to equal accounting taxes in 2006. Pension expenses have been very much under-stated due to an unrealistic assumption of 8% return on plan assets in 2004 (9% prior to 2003). The company reported just $22 million pension expense while putting in $165 in 2004!. We calculate free cash flow closely approximates the net income in 2005 adding back deferred taxes. But free cash flow lagged earnings in 2006 as there was no deferred taxes. Overall, the quality of earnings is probably good, but the quality has declined in 2006 versus prior years. | |
| P/E ratio based on latest four quarters earnings, adjusted | 15.3 |
| Latest fiscal year annual earnings: | $2,158.0 |
| P/E ratio based on latest fiscal year earnings: | 12.2 |
| Fiscal earnings adjusted: | $1,725.0 |
| P/E ratio for fiscal earnings adjusted: | 15.3 |
| Latest four quarters profit as percent of sales | 21.8% |
| Dividend Yield: | 1.8% |
| Price / Sales Ratio | 3.34 |
| BALANCE SHEET ITEMS | |
| Price to (diluted) book value ratio: | 2.53 |
| Quality of Net Assets and Book Value Measurement: With little or no intangible assets, the assets appear to be very strong. The value of the equity overall appears to be conservatively stated. There is a large and growing deferred income tax liability which will likely not be paid for many years. (Witness the $250 million gain due to lower tax rates recognised in Q2 2006). The present cash value of this liability is therefore likely much lower than the book liability and this tends to add to the true economic value of equity and create a stronger, higher quality balance sheet. | |
| Number of Diluted common shares in millions: | 495.9 |
| Controlling Shareholder: none, partly due to a ridiculous 15% ownership restriction imposed by government | |
| Market Equity Capitalization (Value) $ millions: | $25,717.4 |
| Percentage of assets supported by common equity: (remainder is debt or other liabilities) | 43% |
| Interest-bearing debt as a percentage of common equity | 55% |
| Current assets / current liabilities: | 0.7 |
| Liquidity and capital structure: Very Good | |
| RETURN ON EQUITY AND ON MARKET VALUE | |
| Latest four quarters adjusted (if applicable) net income return on average equity: | 17.2% |
| Latest fiscal year adjusted (if applicable) net income return on average equity: | 17.2% |
| Adjusted (if applicable) latest four quarters return on market capitalization: | 6.7% |
| GROWTH RATIOS, OUTLOOK and CALCULATED INTRINSIC VALUE PER SHARE | |
| 5 years compounded growth in sales/share | 9.1% |
| Volatility of sales growth per share: | stable with good growth and recently accelerating |
| 5 years compounded growth in earnings/share | 26.4% |
| 5 years compounded growth in adjusted earnings per share | 14.5% |
| Volatility of earnings growth: | strong steady growth but recent flattening |
| Projected current year earnings $millions: | not available |
| Projected price to earnings ratio: | not available |
| Over the last five years, has this been a truly excellent company exhibiting strong and steady growth in revenues per share and in earnings per share? | Yes |
| Expected growth in EPS based on adjusted fiscal Return on equity times percent of earnings retained: | 12.7% |
| More conservative estimate of compounded growth in earnings per share over the forecast period: | 7.0% |
| More optimistic estimate of compounded growth in earnings per share over the forecast period: | 10.0% |
| OUTLOOK FOR BUSINESS: 2008 could see an earnings decline due to low forestry volumes and the high Canadian dollar. Appears set for continued growth but earnings would fall temporarily if the economy slumps. The company projects 10 to 15% earnings per share growth longer term but now indicates mid to high single digits for 2008 given the impacts of higher Canadian dollar, low forestry volumes. With a possible recession looming in North America there is a risk of an earnings decline in 2008. It seems to us that they are well positioned for the long term as North America continues to import ever-more goods from Asia. Therefore growth will be slow in 2008 but resume at perhaps 7 to 10% thereafter. | |
| Estimated present value per share: We calculate $56.82 if earnings per share grow for 5 years at an average compounded 9% and the shares can then be sold at a P/E of 15. And $68.83 if earnings per share grow at a compounded 12% for 5 years and the shares can then be sold at a P/E of 16 (approximately the current P/E). Both estimates use an 8% required rate of return. This is not a share price prediction./td> | |
| ADDITIONAL COMMENTS | |
| INDUSTRY ATTRACTIVENESS: (These comments reflect the industry and the company’s particular incumbent position within that industry segment.) Michael Porter of Harvard argues that an attractive industry is one where firms are somewhat protected from competition. This industry has very strong barriers to entry in terms of rail rights of way (pass). Not subject to dependency on powerful customers (pass). No dependency on powerful suppliers (pass), The industry as a whole is subject to trucking as substitute product (fail), Probably limited tendency to compete excessively on the basis of price due to competitive advantage over trucks in many cases but tempered by commodity nature of products and presence of fixed cost structure (marginal pass). Overall, appear to be a somewhat attractive industry. | |
| COMPETITIVE ADVANTAGE: Strong management with a focus on simple fundamentals like moving the trains faster and minimizing investments in assets. Acknowledged as the best managed railroad in North America. Appears to have some “pricing power” as evidenced by the ability impose fuel surcharges without affecting volumes. Presumably the tracks that they own are an advantage because their are likely few or no other rail service options available to many of their customers. (Although in some U.S. markets they compete with barges on the Mississippi river). | |
| RECENT EVENTS: Recently completed two relatively smaller acquisitions and a small divestiture of a European investment. | |
| ACCOUNTING AND DISCLOSURE ISSUES: Uses U.S. GAAP. Generally exceptionally good disclosure. Excellent disclosure of freight moved (number of rail cars, ton-miles etc.) and revenue sources and results for different freight types. However, disclosure could be improved by including a 5 year summary in the annual report and by including net income, adjusted net income and average number of basic and fully diluted shares in the 5 year summary. There are some complexities involved in understanding the pension liability. | |
| COMMON SHARE STRUCTURE USED: Normal common shares, 1 vote per share. | |
| MANAGEMENT QUALITY: Excellent management. It appears that these people definitely know how to run a railroad. Their focus on asset utilization such as moving the trains faster (limiting idle time) seems very logical. The excellent level of disclosure in the annual report is a sign of a management that respects the shareholders. | |
| EXECUTIVE COMPENSATION: Long-term incentive payouts were very high in 2005 with two officers receiving U.S. $5 million and the CEO at U.S. $17 million. But the in the prior year the CEO received only $1.6 million. It’s not clear to us if the big 2005 payouts should be treated as annual amounts. The CEO salary and bonus in 2005 was generous but not excessive at about $5 million. The other four big executives received only about $1 million which is really not that high for the top executives of such a large company. Overall, given the size and profitability of this company, we are not concerned about executive compensation at this time. | |
| BOARD OF DIRECTORS: A prestigious board with a number of representatives from the investment community. A typical outside board member has substantial shares (several $million worth) and this insures that their interests are aligned with other shareholders. | |
| Basis and Limitations of Analysis: The following applies to all the companies rated. Conclusions are based largely on achieved earnings, balance sheet strength, earnings growth trend and industry attractiveness. We undertake a relatively detailed analysis of the published financial statements including growth per share trends and our general view of the industry attractiveness and the company’s growth prospects. Despite this diligence our analysis is subject to limitations including the following examples. We have not met with management or discussed the long term earnings growth prospects with management. We have not reviewed all press releases. We typically have no special expertise or knowledge of the industry. | |
DISCLAIMER: All stock ratings presented are “generic” in nature and do not take into account the unique circumstances and risk tolerance of any individual. The information presented is not a recommendation for any individual to buy or sell any security. The authors are not registered investment advisors and the information presented is not to be considered investment advice to any individual. The reader should consult a registered investment advisor or registered dealer prior to making any investment decision. For ease of writing style the newsletter and articles are often written in the first person. But, legally speaking, all information and opinions are provided by InvestorsFriend Inc. and not by the authors as individuals. InvestorsFriend Inc. itself does not have a position in any of the indicated securities while the authors may have a position, as disclosed in each report. The Authors’ positions may subsequently change without notice.
© Copyright InvestorsFriend Inc. 1999 – 2008 All rights to format and content are reserved.