
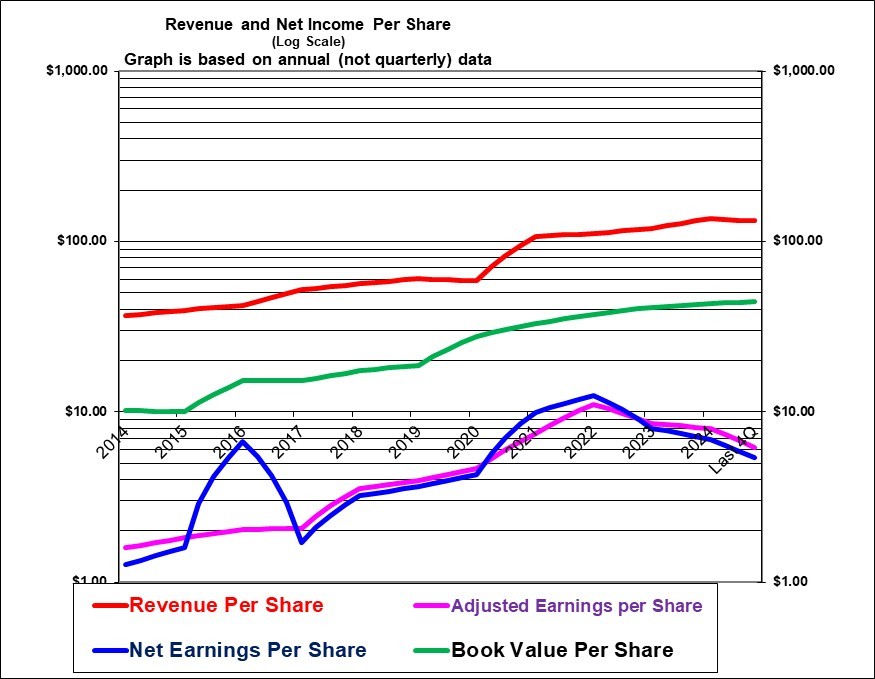
This chart shows very strong historic growth but with an earnings decline in the past three years due to a weak freight market and made worse by the tariff war with thye U.S. 2026 is predicted to show an improvement as growth will likely ultimately resume for this well-managed company.
| TFI International Inc. (TFII, Toronto) | |
| RESEARCH SUMMARY | |
| Report Author(s): | InvestorsFriend Inc. Analyst(s) |
| Author(s)’ disclosure of share ownership: | The Author(s) hold shares |
| Based on financials from: | Dec ’24 Y.E. +Q3 ’25 |
| Last updated: | November 22, 2025 |
| Share Price At Date of Last Update: | $ 121.19 |
| Currency: | $ Canadian |
| Generic Rating (This rating does not consider the circumstances of any individual investor and is therefore not specific advice for any individual): | Buy at $121 |
| Qualifies as a stock that could be bought with confidence to hold for 20 years? | Yes |
| Has Wonderful Economics? | Yes, despite price competition |
| Has Excellent and Trustworthy Management? | Yes! |
| Likely to grow earnings per share at an attractive rate over the next decade? | Yes |
| Positive near-term earnings outlook? | Q4 2025 will be weak with some recovery in 2026 |
| Valuation? | Attractive |
| SUMMARY AND RATING: The graph of revenues per share (red line) shows strong and steady growth until a flat 2025. The adjusted earnings per share growth (purple line) has been very strong indeed but declined quite noticeably in 2023 and again in 2024 and with big decline in 2025 due to a tougher market environment (described as a freight recession). The Value ratios (looking backwards) would support only a Weak Buy Hold rating. Management quality is very strong -they are “on their game”. The insider trading signal is moderately positive. Executive compensation does not seem excessive, although the CEO is very well compensated. The outlook is very weak for Q4 2025 with some recovery expected in 2026. The long-term outlook seems good. It does not appear to have strong competitive or cost advantages other than scale and its very excellent management ability. The economics of the business are strong despite being subject to stiff price competition. It is possible that Amazon’s move into trucking could harm their business somewhat. The CEO and essentially founder of the company believes that the share price is very attractive and he is trustworthy. Overall, despite the recent weakness we would rate this a Buy at Canadian $121. A reasonable strategy would be to buy some now and to add to that if and as the share price declines. | |
| MACRO ENVIRONMENT: Volumes were apparently down in the trucking industry in 2023 compared to 2022 and weakness continued in 2024 and ended the year quite weak and that has become worse through 2025. The company points to subdued economic growth forecasts and the risks associated with the U.S. tariffs including possible higher tariffs and also notes the uncertainty of the middle east wars. Meanwhile interest rates have started to decline which is a positive factor. | |
| LONG TERM VALUE CREATION: The long-term value creation is exceptionally strong. | |
| DESCRIPTION OF BUSINESS: (last updated Q2 2024) TFI International is a Canadian headquartered North American trucking and delivery company with total annual revenues of over $10 Canadian billion dollars. About one third of revenues are from Canada and Two thirds from the U.S. and the U.S focus continues to increase. TFI is focused on acquisitions as well as very efficiently managing its operations. Since 1998, the company has acquired more than 180 companies. Acquired companies continue to operate under their same names and management teams in a decentralised structure. It has the largest trucking fleet in Canada. It’s U.S. operations are now larger than its Canadian operations but it does not have a large market share there. It has 273 terminals/facilities in Canada and 415 in the United States (these numbers have grown significantly in the past few years). It has 28,374 employees (unchanged in the past few years despite acquisitions) and another 8,401 independent contractors (presumably mostly driver/owners of trucks). It owns 14,023 trucks and 43,869 trailers (down from over 48,000 two years ago). The customer base is very diverse – 22% retail, 20% manufactured goods, 11% automotive, 11% metals and mining and the rest is very diverse. | |
| ECONOMICS OF THE BUSINESS: The economics appear to be VERY strong historically although not as strong very recently but still quite good. TFI’s success in managing costs contributes to its strong overall economics. | |
| RISKS: See annual report for a full discussion of risks. Earnings fluctuate with the state of the economy. Some of the important risks include accident liabilities, competition based on price and competition for drivers. | |
| INSIDER TRADING / INSIDER HOLDING: Checking insider trading from November 1, 2024 to November 21, 2025. The founder and CEO exercised options and sold some shares but he increased his ownership over the year and holds 4.57 million shares. Six directors bought but that was likely taking director compensation as shares. There was some selling after exercising options but usually not all shares sold and in some cases no shares sold. The company itself was buying back shares regularly. Overall, the insider trading signal is moderately positive. | |
| WARREN BUFFETT’s CRITERIA: Buffett indicates that all investments must pass four key tests: the business is simple to understand and predict (pass given that trucking is relatively simple business) , has favorable long-term economics due to cost advantages or superior brand power (marginal pass – perhaps its high ROE is evidence of some advantage of scale), apparently able and trustworthy management (pass given the profit history and the general tone of its reports), a sensible price – below its intrinsic value (pass given its value ratios), Other criteria that have been attributed to Buffett include: a low debt ratio (pass), good recent profit history (fail given the weak resent results) little chance of permanent loss of the investors capital (pass) a low level of maintenance type capital spending required to maintain existing operations excluding growth (marginal pass at best as trucks are constantly replaced) | |
| MOST RECENT EARNINGS AND SALES TREND: The recent earnings growth trend has been quite weak. The revenue per share growth in the past four quarters was minus 7%, minus 8%, 5%, and 5%. The earnings per share growth in the last four quarters was minus 25%, minus 22%, minus 39% and minus 31%. The adjusted earnings per share DECLINE in 2024 was 7%, while revenues per share were up 14% (driven by a large acquisition). The adjusted earnings per share DECLINE in 2023 was 23%, while revenues per share were up 7%. The adjusted earnings per share gain in 2022 was 53% but revenue per share growth was just 6%. The adjusted earnings per share growth in 2021 was 59% and the revenue per share growth was 83%! | |
| INDUSTRY SPECIFIC STATISTICS: | |
| Earnings Growth Scenario and Justifiable P/E: With a dividend yield of 2.1% and a payout ratio of 41% of adjusted earnings, the stock is pricing in growth of perhaps 9% or more. | |
| VALUE Ratios: Analysed at a price of Canadian $121 and U.S. $86. The Price to book value ratio appears somewhat high at 2.75 and note that the company itself has paid very significant premiums in acquisitions. But that may be well justified by the historically high ROE and the price to book is down from a recent high over 4.5. The dividend yield is quite modest at 2.1% despite recent dividend increases. The adjusted P/E ratio is not attractive at 20. The ROE is strong at 14% but down from historic levels of above 20%. Intrinsic value is calculated as just $91 if earnings per share grow at 5% for five years and the P/ E declines to 14 and $129 if earnings grow at 9% annually and the P/E declines to 17. Both estimates use a 7.0% required rate of return. Overall, the value ratios would suggest a rating of only Hold at this point. | |
| TAXATION: Nothing Unusual. | |
| SUPPORTING RESEARCH AND ANALYSIS | |
| Symbol and Exchange: | TFII, Toronto |
| Currency: | $ Canadian |
| Contact: | 647 729-4079 |
| Web-site: | www.tfiintl.com |
| INCOME AND PRICE / EARNINGS RATIO ANALYSIS | |
| Latest four quarters annual sales $ millions: | $11,127.3 |
| Latest four quarters annual earnings $ millions: | $452.6 |
| P/E ratio based on latest four quarters earnings: | 22.6 |
| Latest four quarters annual earnings, adjusted, $ millions: | $521.9 |
| BASIS OR SOURCE OF ADJUSTED EARNINGS: With a few exceptions we used managements figure for adjusted earnings from continuing operations. In 2020 we deducted the after-tax benefit of the Canada Emergency Wage Subsidy because there was no indication that the money was used to keep people working. | |
| Quality of Earnings Measurement and Persistence: The adjusted earnings seem relatively reliable. Depreciation is an estimated figure and is relatively large in relation to earnings and so the earnings are relying on the accuracy and sufficient conservatism of the depreciation amount. Depreciation does seem to be conservative as evidenced by the frequent sale of assets at a gain. Certain transaction and restructuring costs have not been added back in adjusted earnings. Overall the earnings and adjusted earnings appear to be conservatively stated. | |
| P/E ratio based on latest four quarters earnings, adjusted | 19.6 |
| Latest fiscal year annual earnings: | $584.7 |
| P/E ratio based on latest fiscal year earnings: | 17.5 |
| Fiscal earnings adjusted: | $677.4 |
| P/E ratio for fiscal earnings adjusted: | 15.1 |
| Latest four quarters profit as percent of sales | 4.7% |
| Dividend Yield: | 2.1% |
| Price / Sales Ratio | 0.92 |
| BALANCE SHEET ITEMS | |
| Price to (diluted) book value ratio: | 2.75 |
| Balance Sheet: (last updated for Q2 2024). Assets are comprised as follows: 35% is purchased goodwill or the equivalent, 21% is rolling stock (trucks and trailers) 18% is land and buildings and 17% is current assets most of which is trade receivables 7% of assets are capitalised leases, 1% is equipment and 1% is other assets. The other side of the balance sheet which supports these assets is comprised as follows: 36% debt, 35% common equity, 11% current payables, 8% capitalised lease liabilities, 7% deferred income taxes, and 3% provisions and other liabilities. Overall, the balance sheet appears relatively strong assuming that the goodwill is solid which the 21% ROE indicates is very much the case. Debt is reasonable in relation to earnings and cash flow. | |
| Quality of Net Assets (Book Equity Value) Measurement: (Updated Q2 2024) About 35% of the assets here are purchased intangible (goodwill and the equivalent). At the time of that update the shares were trading at about 4.4 times book value (but this is down to 2.75 as of November 22, 2025). The company is valued for its earnings not for the value of the assets. Based on earnings and frequent sales of assets at gains, the assets are worth more than book value. | |
| Number of Diluted common shares in millions: | 82.7 |
| Controlling Shareholder: There is no controlling shareholder as such. It is reported that Capital Research Group Global Investors owns 10% of the shares. The long-time CEO owns about 5.9% of the shares. He effectively controls the corporation in the absence of an actual controlling owner. | |
| Market Equity Capitalization (Value) $ millions: | $10,028.0 |
| Percentage of assets supported by common equity: (remainder is debt or other liabilities) | 37.1% |
| Interest-bearing debt as a percentage of common equity | 91% |
| Current assets / current liabilities: | 1.1 |
| Liquidity and capital structure: The debt level is not excessive at 91% of the book equity level and in relation to earnings and cash flow. | |
| RETURN ON EQUITY AND ON MARKET VALUE | |
| Latest four quarters adjusted (if applicable) net income return on average equity: | 14.0% |
| Latest fiscal year adjusted (if applicable) net income return on average equity: | 18.6% |
| Adjusted (if applicable) latest four quarters return on market capitalization: | 5.2% |
| GROWTH RATIOS, OUTLOOK and CALCULATED INTRINSIC VALUE PER SHARE | |
| 5 years compounded growth in sales/share | 17.6% |
| Volatility of sales growth per share: | Steady Growth |
| 5 Years compounded growth in earnings/share | 13.5% |
| 5 years compounded growth in adjusted earnings per share | 15.1% |
| Volatility of earnings growth: | Steady Growth until a recent decline |
| Projected current year earnings $millions: | not available |
| Management projected price to earnings ratio: | not available |
| Over the last ten years, has this been a truly excellent company exhibiting strong and steady growth in revenues per share and in (adjusted) earnings per share? | Yes |
| Expected growth in EPS based on adjusted fiscal Return on equity times percent of earnings retained: | 10.9% |
| More conservative estimate of compounded growth in earnings per share over the forecast period: | 5.0% |
| More optimistic estimate of compounded growth in earnings per share over the forecast period: | 9.0% |
| OUTLOOK AND AMBITIONS FOR BUSINESS: The company is forecasting a very weak Q4 with earnings per share down about 30% versus Q4 2024 and down a withering 50% versus Q4 2024. But they expect a noticeable improvement in 2026. | |
| LONG TERM PREDICTABILITY: It seems reasonable to predict that the company will continue to grow its earnings over the years however its earnings are subject to year to year volatility. | |
| Estimated present value per share: We calculate Canadian $91 if adjusted earnings per share grow for 5 years at the more (very?) conservative rate of 5% and the shares can then be sold at a P/E of 14 and $129if adjusted earnings per share grow at the more optimistic rate of 9% for 5 years and the shares can then be sold at a P/E of 17. Both estimates use a 7.0% required rate of return. (Since earnings are currently somewhat depressed, growth could be higher) | |
| ADDITIONAL COMMENTS | |
| INDUSTRY ATTRACTIVENESS: (These comments reflect the industry and the company’s particular incumbent position within that industry segment.) Michael Porter of Harvard argues that an attractive industry is one where firms are somewhat protected from competition based on the following four tests. Has barriers to entry (marginal pass as capital is likely the largest barrier but scale is also important). No issues with powerful suppliers (pass). No issues with dependence on powerful customers (pass as the largest customer is less than 5% of revenue), No potential for substitute products (pass) No tendency to compete ruinously on price (marginal pass as the industry does compete on price). Overall this industry appears to be marginally attractive to an established large incumbent. It may be attractive for the lowest cost incumbents. | |
| COMPETITIVE ADVANTAGE: The company indicates that competitors compete primarily on price and reliable service. Therefore cost management and scale are presumably very important. It likely has some competitive advantage in Canada due to scale as it is the largest trucking company in Canada. It’s not clear that it would have any special advantages in the U.S. market. They do appear to be particularly well managed and are skilled in cutting costs when needed. They note a disadvantage against trucking companies that improperly classify drivers as contractors when they are employees in substance. Government action is expected to reduce this. | |
| COMPETITIVE POSITION: The company has the largest trucking fleet in Canada as well as a significant presence in the U.S. market. It is a fragmented industry. | |
| RECENT EVENTS: The company continues to make fairly numerous acquisitions for growth. The 2024 acquisition of Daseke was its latest large acquisition. In addition it made 10 other smaller acquisitions in 2024. The business environment and competition has led to noticeable revenue and steep earnings declines in its existing businesses over the past two years and particularly starting in the last quarter of 2024. | |
| ACCOUNTING AND DISCLOSURE ISSUES: A change to reporting in U.S. dollars was warranted but complicates comparisons to the past results. We found the disclosure to be good. | |
| COMMON SHARE STRUCTURE USED: Normal, one vote per share. | |
| MANAGEMENT QUALITY: The chairman and CEO, Alain Bedard has led the company since 1996. Management quality appears to be extremely high. Listening to the conference call, the CEO is extremely open with his thoughts and is very knowledgeable. He knows his numbers. He knows what drives profit. In addition, this management has shown excellent ability to trim costs when needed in response to revenue declines. And they have jettisoned less profitable business. It is a rare management that is willing at times to “fire” customers. It seems they don’t to waste time and energy and resources on customers that are insufficiently profitable. The company has a strong focus on profitability and return on capital by division. | |
| Capital Allocation Skills: This skill is particularly important for TFI which has a stated major goal of adding value through acquisitions. It has a VERY strong track record. It made a very wise choice in divesting certain weaker lines of business some years ago. It has made some extremely good acquisitions and particularly the ground operations of UPS – although in 2025 profits are down substantially. Its aggressive share buy back program has apparently been a good use of capital even at a time when the company was also very active in making acquisitions. Share repurchases were somewhat more moderate in 2024 when the shares were at their highest value but nevertheless may not have been wise at that time. The move towards a more “asset light” approach appears to have been wise. | |
| EXECUTIVE COMPENSATION: In 2024 the CEO received total compensation of U.S. $8.9 million. The other four named officers were in the U.S. $1.1 to $1.6 million range. This level of compensation is arguably not excessive or a concern given the size and success of the company. The compensation was relatively unchanged since 2021 although somewhat lower for the CEO in 2024. It does, however look somewhat too heavily weighted to the CEO although the CEO as traditionally the only man on the conference call (but lately accompanied by the CFO) is a VERY hands on CEO. | |
| BOARD OF DIRECTORS: (Updated November 2025) Warren Buffett has suggested that ideal Board members be owner-oriented, business-savvy, interested and financially independent. Here the Board consists of eleven members, mostly retired executives (from banking, federal cabinet, industrial products distributor, food, and trucking) . There appears to a good level of business knowledge and the members are likely wealthy enough not to be unduly influenced by their compensation at TFI which is not excessive I suppose at $200k per year. Interesting the Board compensation was recently changed to cash only with no stock compensation./ | |
| Basis and Limitations of Analysis: The following applies to all the companies rated. Conclusions are based largely on achieved earnings, balance sheet strength, achieved earnings per share growth trend and industry attractiveness. We undertake a relatively detailed analysis of the published financial statements including growth per share trends and our general view of the industry attractiveness and the company’s growth prospects. Despite this diligence our analysis is subject to limitations including the following examples. We have not met with management or discussed the long term earnings growth prospects with management. We have not reviewed all press releases. We typically have no special expertise or knowledge of the industry. | |
| DISCLAIMER: All stock ratings presented are “generic” in nature and do not take into account the unique circumstances and risk tolerance and risk capacity of any individual. The information presented is not a recommendation for any individual to buy or sell any security. The authors are not registered investment advisors and the information presented is not to be considered investment advice to any individual. The reader should consult a registered investment advisor or registered dealer prior to making any investment decision. For ease of writing style the newsletter and articles are often written in the first person. But, legally speaking, all information and opinions are provided by InvestorsFriend Inc. and not by the authors as individuals. The author(s) of this report may have a position, as disclosed in each report. The authors’ positions may subsequently change without notice. | |
| © Copyright: InvestorsFriend Inc. 1999 – 2025. All rights to format and content are reserved. | |