
IS THE S&P 500 INDEX A GOOD INVESTMENT AT THIS TIME?
This is a lengthy and detailed article but the first few paragraphs give you to conclusions.
What Return Can You Reasonably Expect From Investing today in the S&P 500 Index?
This article is your One-Stop Page to Understand The S&P 500 Earnings and Dividend Yield and how these relate to The Fair Value of The S&P 500 Index.
This article (which draws on Warren Buffett’s teachings1) provides:
- Calculations of the current fair value of the S&P 500 index based on several scenarios
- The Expected next 10-year average Return per Year from the S&P 500 based on earnings growth and terminal P/E Assumptions.
- The S&P 500 index P/E ratio (based on trailing and forward earnings)
- Earnings and earnings yield on the S&P 500 index (GAAP, operating and forward earnings)
- Dividend Yield on the S&P 500 index
- A link to the source for all the S&P 500 data on the the Standard and Poors web site
- The Exchange Traded Fund (ETF) symbols to use to invest in the S&P 500 index
Mathematically, the Fair Value of the S&P 500 Index can be calculated based on just four things: the return that investors require, the current earnings and dividend level, the expected growth in earnings and dividends, and the probable P/E ratio that the index can be expected to be sold for at the end of a reasonable holding period of say 10 years.
This article provides a range of values depending on the scenario chosen. I believe that the analysis indicates that the fair value for the S&P 500 Index is about 5,745 as a point estimate. And so it appears to be over-valued at its recent value of 6843. My assumption for this estimate is that the S&P normalized earnings and dividend will grow at about 7.0% per year (which might be ambitious on top of all the recent earnings growth) and sell at a P/E of 20 in ten years (which is somewhat above its long-term average P/E of 17.9 but is below the 30 year average of 24.2) and that investors require a minimum expected return of 7.0%.
You can compare my fair value estimate of 5475 to the current S&P 500 level which is available here.
This analysis is as of February 17, 2026. However the calculated fair value of the S&P 500 index is not affected by the precise date of the analysis and my fair value estimate of 5745 will not change until at least after the next set of actual and/or forecast quarterly earnings numbers becomes available, and even then will not change much. As of February 17, 2026, the S&P 500 index at 6,843 appeared to me to be over-valued at 19% above my point estimate of fair value and based on a long-term investment and based on reasonable assumptions.
To be notified when we next update this article, simply join the list for our free investment newsletter. The sign-up link is at the top of every page on this site. If you don’t find our newsletter valuable, every issue provides a link to get off of our email list.
ANALYSIS
A quick indication of whether or not the S&P 500 index is fairly valued can be provided by simply looking at its trailing and forward P/E ratio. As of February 17, 2026, the S&P 500 was at 6843 and had a 2025 trailing year actual reported earnings P/E ratio of 27.5 and a forward P/E ratio (based on expected GAAP earnings in the next four quarters to September 30, 2025) of 24.1.
The trailing P/E of 27.5 is 53% higher than the historical average trailing year P/E ratio of 18 and it’s 20% above the 30 year average of 23. The forward P/E of 24.1 is 34% higher than the historical average trailing year P/E ratio of 18 and is 5% above the 30 year trailing P/E average. Note that analyst forward earnings estimates are usually considered to be biased high.
Overall, the quick indication is that the S&P 500 index is probably somewhat or even significantly over-valued, at this time at 6,843 However this might be jumping to conclusions. We have to consider whether the forecast earnings level on the index is a reasonable estimate and at a sustainable level and what the outlook is.
This article explores the question of the estimated fair value of the S&P 500 index in much more detail below.
Importantly, an analysis of the fair value of the S&P 500 index will not likely provide a short-term indicator of market direction but it should provide a long-term indicator of the expected return from investing in the S&P 500 index at this time.
The attractiveness of the S&P 500 index level can be judged by looking at the current level of earnings and dividends of the S&P 500 index stocks, projecting the future rate of earnings and dividend growth and by considering the minimum return required by investors. Analysts often apply valuation techniques to individual stocks. It is actually far easier to apply these calculations to a stock index since an index constitutes a portfolio and therefore its diversification eliminates much or most of the random noise of unexpected events that affect individual companies. Still, many challenges remain in applying this analysis and its results, while providing some indication for the long-term, can offer no insight for the short-term. The index remains vulnerable to changes in interest rates and the growth rate of the economy but is usually largely insulated from the numerous random events that can impact an individual stock.
It is perhaps worth noting that top 5 stocks in the S&P 500 represent 26% of its value and the top 10 represent 35%. This concentration could make the index less predictable.
What is the Earnings and P/E ratio on the S&P 500 index right now? (February 17, 2026 with the index at 6843)?
Data from Standards and Poors itself provides no less than four quite different answers to the above question based on different views of the earnings on the S&P 500 index.
| S&P 500 Index Earnings Type | Annual Earnings on Index | P/E Ratio at S&P index 6843 | Earnings Yield (Not dividend yield!) |
| Actual latest year (trailing four quarters to December 31, 2025) GAAP earnings (as reported to February 17, 2026) | $249 | 27.5 | 3.6% |
| Latest year “operating” earnings (removes certain “unusual” items) | $265 | 25.8 | 3.9% |
| Forecast forward GAAP earnings for the next year (2026 estimates summed by individual company) | $284 | 24.1 | 4.2% |
| Forecast forward operating earnings for the next year ( 2026 estimates summed by individual company) | $307 | 22.3 | 4.5% |
| For Comparison here are the S&P 500 Actual GAAP Earnings in prior years: | Earnings | Historical Year End P/E | Historical Earnings Yield |
| 2024 Actual GAAP Earnings, S&P ended at 5882 | $210.17 | 28.0 | 3.6% |
| 2023 Actual GAAP Earnings, S&P ended at 4770 | $192.43 | 24.8 | 4.0% |
| 2022 Actual GAAP Earnings, S&P ended at 3840 | $172.75 | 22.2 | 4.5% |
| 2021 Actual GAAP Earnings, S&P ended at 4766 | $197.87 | 24.1 | 4.2% |
| 2020 Actual GAAP Earnings, S&P ended at 3756 | $94.13 | 39.9 (Anomalous low earnings – pandemic) | 2.5% |
| 2019 Actual GAAP Earnings, S&P ended at 3231 | $139.47 | 23.2 | 4.3% |
| 2018 Actual GAAP Earnings, S&P ended at 2507 | $132.39 | 18.9 | 5.3% |
| 2017 Actual GAAP Earnings, S&P ended at 2674 | $109.88 | 24.3 | 4.1% |
| 2016 Actual GAAP Earnings, S&P ended at 2239 | $94.55 | 23.7 | 4.2% |
| 2015 Actual GAAP Earnings, S&P ended at 2044 | $86.53 | 23.6 | 4.2% |
| 2014 Actual GAAP Earnings, S&P ended at 2059 | $102.31 | 20.5 | 4.9% |
| 2013 Actual GAAP Earnings, S&P ended at 1848 | $100.20 | 18.4 | 5.4% |
| 2012 Actual GAAP Earnings, S&P ended at 1426 | $86.51 | 16.5 | 6.1% |
| 2011 Actual GAAP Earnings, S&P ended at 1258 | $86.95 | 14.5 | 6.9% |
| 2010 Actual GAAP Earnings, S&P ended at 1258 | $77.35 | 16.3 | 6.1% |
| 2009 Actual GAAP Earnings, S&P ended at 1115 | $50.97 | 21.9 | 4.6% |
| 2008 Actual GAAP Earnings, S&P ended at 903 | $14.88 | 60.7 (anomalous low earnings – financial crisis) | 1.6% |
| 2007 Actual GAAP Earnings, S&P ended at 1468 | $66.18 | 22.2 | 4.5% |
| 2006 Actual GAAP Earnings, S&P ended at 1418 | $81.51 | 17.4 | 5.7% |
| 2005 Actual GAAP Earnings, S&P ended at 1248 | $69.93 | 17.8 | 5.6% |
| 2004 Actual GAAP Earnings, S&P ended at 1212 | $58.55 | 20.7 | 4.8% |
| 2003 Actual GAAP Earnings, S&P ended at 1112 | $48.74 | 22.8 | 4.4% |
| 2002 Actual GAAP Earnings, S&P ended at 880 | $27.59 | 31.9 | 3.1% |
| 2001 Actual GAAP Earnings, S&P ended at 1148 | $24.69 | 46.1 (anomalous low earnings – tech wreck) | 2.2% |
| 2000 Actual GAAP Earnings, S&P ended at 1320 | $50.00 | 26.4 | 3.8% |
| 1999 Actual GAAP Earnings, S&P ended at 1469 | $48.17 | 30.5 | 3.3% |
| 1998 Actual GAAP Earnings, S&P ended at 1229 | $37.71 | 32.6 | 3.1% |
When you ask the “simple” question of “what is the earnings on the S&P 500 index?” or “what is its P/E ratio?” you are given a number of quite different answers. We can help you better understand the different answers.
Most analysts focus on the forecast year (called forward) “operating” earnings scenario, summed by individual company which is usually the highest earnings number and lowest P/E forecast. I find that to be overly aggressive as it ignores all unusual losses. (Surely on a group of 500 companies a certain amount of so-called “unusual” losses is to be expected every year and should not be ignored?)
As of February 17, 2026, the S&P 500 index was at 6843 and had a trailing Price Earnings Ratio (“P/E”) of 27.5 (note that the long-term historical average is 18 but the 30 year average is higher at 23) based on actual trailing reported earnings and had a current dividend yield of 1.17% The trailing P/E based on the past 12 months reported operating earnings (eliminates unusual one-time items) was 25.8. The forward S&P 500 P/E ratio based on projected reported actual accounting GAAP earnings was at 24.1 (based on an expected increase in earnings of 15%). The forward P/E based on a forecast or forward operating earnings (eliminates all forecast unusual company-specific one-time items) was at 22.3 (based on the weighted sum of individual company forecasts). The forecast calls for an increase in operating earnings of 16%. This seems like an ambitious forecast of earnings growth on top of all the recent increases but maybe the magnificent seven can provide that.
Most analysts might focus on forecast operating earnings for the index (P/E of 22.3) as the best estimate since it eliminates company-specific unusual gains and losses and is future oriented.
Given that projected earnings tend to be optimistic and also ignore all “unusual” losses, I normally prefer to simply use the actual trailing P/E, or equivalently the actual trailing GAAP earnings level. This figure is $246, for a P/E of 27.5. It is important to understand that this starting earnings level is a very major determinant in my calculation of the fair value of the S&P 500 index and that it can be a difficult number to estimate if the actual trailing earnings is not judged to be at a “normal” level. At this time, the trailing year earnings are somewhat above the trend line (see graph below). For that reason, it might be best to use something a little lower and closer to the trend line of earnings. But I also note that analysts expect reported earnings to grow to $284 in the next year. I will use the actual trailing year earnings of $246 as my starting point. It’s not totally clear if the earnings are above the trendline. Earnings are a higher percent of GDP. But perhaps it is reasonable that the 500 largest companies become a larger portion of the stock market and the economy.
The S&P 500 index represents a portfolio of 500 stocks. For each $6843 (the index value) purchased, the underlying companies in the portfolio were recently earning about $246 per year and currently paying an annualized dividend of about $80 (1.17%).
When we buy the S&P 500 index, we can therefore think of it as being an investment that (as of February 17, 2026) costs $6843 and currently earns about $246 per year and pays a current dividend of $80 (1.17%) per year. It’s worth thinking about whether or not this portfolio of businesses is a good investment at or around its recent level of $6843.
We know that the S&P 500 index was at 6,843 on February 17, 2026. We can estimate what the S&P theoretically “should” be trading at based on the value of its current earnings and dividends and the projected growth in those earnings and dividends. This intrinsic value approach calculates the value of the projected earnings and dividends for a ten year period and then assumes that the index is sold at some projected future P/E ratio.
In addition to the beginning earnings and dividend level, three additional factors are required to calculate the fair value at which the S&P 500 should be trading at. These are, 1. The forecast average annual growth rate in earnings and dividends over the next ten years. 2. The forecast P/E ratio at which the S&P index will be trading in ten years time. 3. The estimated rate of return required by investors.
The S&P 500 portfolio average earnings arguably should (in the longer term) grow at a rate close to the growth rate of the U.S. economy in nominal (including longer-term expected inflation) terms. I believe a prudent estimate for this nominal earnings long-term growth rate is no higher than 6% to 8% and I would focus on about 7.0%. This 6% to 8% earnings and and nominal GDP growth could occur with real GDP growth of about 4% (which may be ambitious) and inflation of 2% to 4%. We have a short article that both explains why (quoting Warren Buffett) and also demonstrates that historically the S&P 500 earnings have tended to grow at about the same rate as nominal GDP growth in the long run.
Is my assumption of S&P 500 earnings growth of only 6 to 8% and nominal GDP growth of 6 to 8% too low? Afterall, The S&P earnings growth rate since 2015 has been 11.1% compounded annually. But that has been unusually high. The S&P 500 earnings growth rate since 2013 has been 7.8%, since 1990 has been 7.2%, since 1980 – 6.1%, since 1960 – 7.07%. So, no, my 6 to 8% growth assumption is not too low by historical standards. Possibly growth in the next 10 years will be more like 10% annually driven by new technologies, lower income taxes and and/or less competition. This is just the earnings growth which drives the S&P 500 index level. I have also accounted for dividends which do add to the total return.
The following graph illustrates that the S&P 500 earnings have trended up at about the same rate as GDP growth over the long-term, although certainly with substantial volatility around the trend in individual years and over short periods of years.
This graph also clearly illustrates that the U.S. GDP (In nominal dollars, not inflation adjusted dollars) has trended up steadily and has never failed to grow over say a three year period, except in the case of the 1930’s depression.
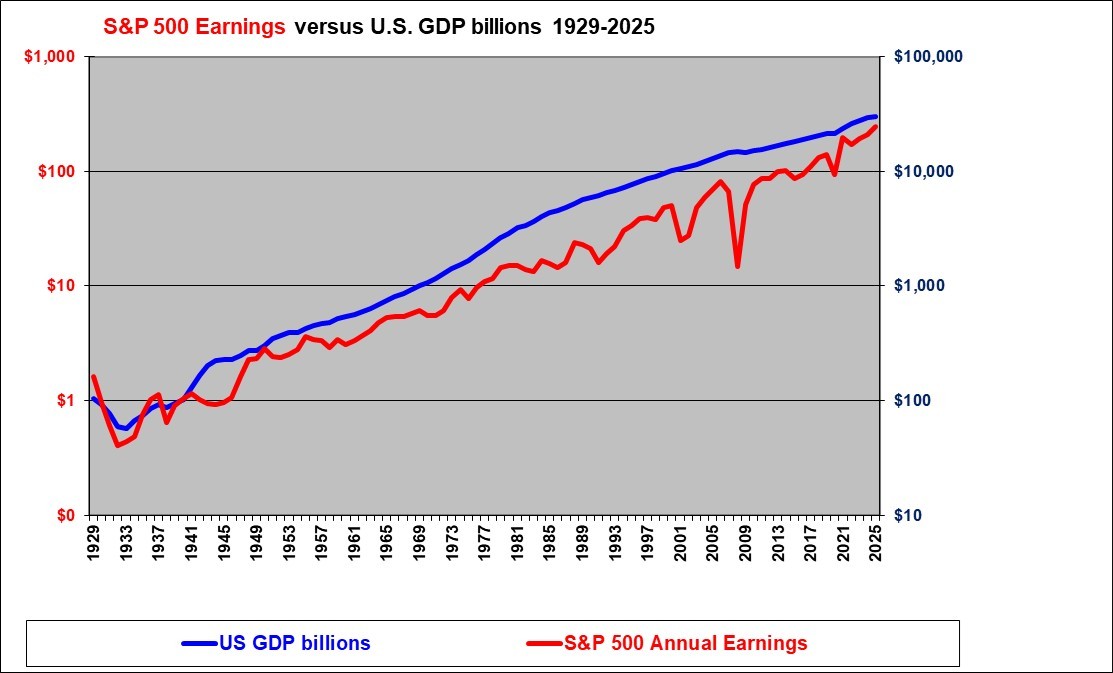
Note that we use a logarithmic scale on this chart. Logarithmic scales should always be used, on data that grows over time, when the time period is more than about 30 years because otherwise the lines will rise up exponentially (will “hockey stick”). A constant percentage historic growth rate plots as a straight line on a logarithmic chart. Note also that the left and right scales are consistent in that each rises exactly 10,000 fold from bottom to top and each point on the right GDP scale is exactly 100 times higher than the corresponding point on the left S&P earnings scale. Many analysts improperly present data with inconsistent scales.
The S&P 500 earnings (the red line) plunged with the financial crisis in 2007 and 2008 after reaching a peak in 2006. This graph shows that there is volatility in the relationship of S&P earnings to GDP. Earnings recovered as of 2011 and have grown VERY strongly since then with the exception of the pandemic in 2020. The Trump Income tax cut of 2018 has boosted earnings since then.
The GDP figure is showing a small dip in 2009 with a full recovery by 2010 and then continued growth until the minor decline with the pandemic in 2020. The pandemic decline has been followed by strong growth in U.S. GDP since 2020. Note that the GDP figures here are in nominal dollars, whereas reports of GDP growth percentages almost always refer to real, inflation-adjusted dollars.
Having determined and discussed the earnings level on the S&P 500 index we also need to make an assumption about the P/E level that is likely to apply to the index in the longer term.
The average for the S&P 500 P/E ratio since 1949 is 17.8 (this eliminates from the average any P/E greater than 50 which only occurred in 2008 when the earnings plunged to abnormally low levels). The average (again eliminating the outlier 60.7 of 2008) in the past 30 years has been 23.3. The Justifiable P/E changes with earnings expectations and the market’s required return on equities.
The linked article states “I have conservatively calculated that the current Justifiable P/E is about 14.3 assuming that with today’s low interest rates investors require about a 7% expected return and assuming that competition will drive available returns down to the required 7% level.” The article also indicates that if companies can deliver in perpetuity an 8% ROE when investors only require 7% (perhaps due to a lack of corporate competition) then a P/E of 21.4 can be justified but we considered that to violate equilibrium conditions. However, it does appear that companies have been able to earn ROEs higher than the required return and to do so consistently which does justify a higher P/E. The long-run P/E range used in our table below is 17 to 23. I had historically used a lower range such as 15 to 19 but the persistently high P/E levels arguably support a higher range
I would estimate that a minimum (pre-tax) expected return required by stock investors (given today’s interest rates -which are expected to moderate somewhat) is in the range of 6% to 8%. The higher return required by investors then the lower the price or level that investors should be willing to pay for the index today, all else being equal.
The following table calculates the value that the S&P 500 will be at in ten years given various forecasts for the earnings growth and given various scenarios for the forecast P/E ratio that will apply at that time. The second last column of the table then shows the fair or present value that we should be willing to pay today for the cash flows that would result from ten years of dividends plus the assumed cash from selling the index in ten years time. The present value is calculated based on various scenarios for the required return or discount rate.
The last column in the table indicates the average annual return that would be made if the S&P 500 is purchased at its recent level of 4559 and if earnings and dividends grow at the indicated rate and the index trades at the indicated P/E ratio in ten years time.
| S&P 500 Current Annual Earnings Estimate | S&P 500 Current Annual Dividends | Earnings and Dividend Growth forecast | S&P 500 P/E forecast in 10 years | Resulting S&P 500 index in 10 years | Required Return | Resulting S&P 500 index Fair Value Today | Resulting Fair P/E today | Return per Year Buying at S&P 6843 |
| $ 246 | $ 80 | 6.0% | 17 | 7,489 | 6% | 4,982 | 20.3 | 2.5% |
| $ 246 | $ 80 | 6.0% | 20 | 8,811 | 6% | 5,720 | 23.3 | 4.0% |
| $ 246 | $ 80 | 6.0% | 23 | 10,133 | 6% | 6,458 | 26.3 | 5.4% |
| $ 246 | $ 80 | 6.0% | 17 | 7,489 | 8% | 4,192 | 17.0 | 2.5% |
| $ 246 | $ 80 | 6.0% | 20 | 8,811 | 8% | 4,804 | 19.5 | 4.0% |
| $ 246 | $ 80 | 6.0% | 23 | 10,133 | 8% | 5,416 | 22.0 | 5.4% |
| $ 246 | $ 80 | 7.0% | 17 | 8,227 | 6% | 5,463 | 22.1 | 3.4% |
| $ 246 | $ 80 | 7.0% | 20 | 9,678 | 6% | 6,247 | 25.4 | 5.0% |
| $ 246 | $ 80 | 7.0% | 23 | 11,130 | 6% | 7,058 | 28.7 | 6.3% |
| $ 246 | $ 80 | 7.0% | 17 | 8,227 | 8% | 4,571 | 18.6 | 3.4% |
| $ 246 | $ 80 | 7.0% | 20 | 9,678 | 8% | 5,243 | 21.3 | 5.0% |
| $ 246 | $ 80 | 7.0% | 23 | 11,130 | 8% | 5,916 | 24.0 | 6.3% |
| $ 246 | $ 80 | 8.0% | 17 | 9,029 | 6% | 5,929 | 24.1 | 4.4% |
| $ 246 | $ 80 | 8.0% | 20 | 10,622 | 6% | 6,819 | 27.7 | 6.0% |
| $ 246 | $ 80 | 8.0% | 23 | 12,215 | 6% | 7,709 | 31.3 | 7.3% |
| $ 246 | $ 80 | 8.0% | 17 | 9,029 | 8% | 4,982 | 20.3 | 4.4% |
| $ 246 | $ 80 | 8.0% | 20 | 10,622 | 8% | 5,720 | 23.3 | 6.0% |
| $ 246 | $ 80 | 8.0% | 23 | 12,215 | 8% | 6,458 | 26.3 | 7.3% |
Conclusions
Given the current trailing-year earnings level of $246 and the current dividend of $80, a range of expected earnings growth rates, the return required by investors and the assumed P/E ratio that will apply in ten years I can calculate that today’s S&P 500 index should be anywhere from as low as 4192 (assumes that our starting adjusted earnings level of $246 is reflective of a normalized starting point, that the market P/E falls to 17, earnings grow at 6% annually and equity investors require an expectation of making 8%) to as high as 7709 (assumes our starting adjusted trailing year earnings level of $246 is reasonable, a terminal market P/E of 23 will apply in ten years, earnings will grow at 6% per year and investors only require an expectation of earning 6% on equities).
My own fair-value point estimate is 5745. It’s based on the average of the two bolded rows. This assumes that equity investors require a minimum 7.0% expected return, that the S&P earnings and dividend will grow at 7.0% and that the long run S&P 500 P/E ratio is 20. Higher S&P 500 index values are implicitly assuming that the current normalized starting earnings level is higher than $246, or, more likely, that earnings growth will exceed 7.0% annually, that the justifiable long-run P/E exceeds 20, and/or that investors require less than a 7.0% (pre-tax) return. Or some combination of these factors.
My range of investor required expected returns of 6% to 8%, although low by historic standards, is attractive compared to the recent 10-year U.S. government bond yield of about 4.1%. It also represents an attractive real return of 4% to 6% after an expected 2% to 3% long-term inflation rate. But the long-term inflation rate that investors should expect is currently quite uncertain.
The last column in the table shows that under the indicated assumptions, if money is invested today in the S&P 500 and held for ten years and if the earnings and dividends grow at the rate indicated and the P/E ratio in ten years is as indicated then the average returns per year would range from 2.5% to 7.3% per year. With the 10-year treasury bond currently yielding about 4.1% these estimated returns are mostly not attractive. Of course the earnings growth on the S&P 500 could be lower than an average 6% per year and the terminal P/E ratio could be lower than 17, in which cases a lower (and negative) return could result. It’s also possible that the P/E ratio will remain above 23 and/or that earnings will grow faster than 8% per year.
One can always come up with losing scenarios, or winning scenarios but based on historical earnings growth and P/E ratios it would appear that over this next ten year holding period, the S&P 500 is not very likely to provide attractive returns.
The overall conclusion is that a fair value of the S&P 500 index based on its trailing GAAP earnings is probably about 5745 as a point estimate. Since this is based on many assumptions it should be taken as a rough indication and certainly not as an exact determination.
My point estimate (the average of the two bolded rows) is that the S&P 500 in ten years will be at about 9,678 (assumes 7.0% annual earnings growth from $246 and a final P/E ratio of 20). Buying the S&P 500 index when it is at about 6843 (the level when this article was written) would, on that basis, be expected (but certainly not guaranteed) to result in a forecast return of about 5.0% per year if held for the next 10 years. The expected standard deviation around this expected 5.0% is also large so that the actual return over the next 10 years might be expected to fall within a range of about 0% to 10% per year with some chance of being outside that range. And that return includes dividends and is before trading costs and personal taxes. And in any given year, the return will range wildly and should most definitely be expected to be negative in some years.
It is impossible to predict where the S&P 500 index will go in the next year. But it is possible to estimate its fair value and therefore whether or not it is currently over-valued based on reasonable growth expectations and a reasonable expectation around the initial earnings (or equivalently the initial P/E level) and around the terminal P/E ratio. Caution is warranted because the S&P 500 can sometimes spend years in an over-valued or an under-valued-state. But ultimately, as we have seen in the early 2000’s crash, and the crash of 2008 and early 2009, valuation does correct itself. (And sometimes over-corrects to the downside such as we saw in March of 2020).
You can easily invest in the S&P 500 index by buying the ishares S&P 500 index Exchange Traded Fund under symbol IVV on the New York Stock Exchange. And if you are really bullish you can buy the double bull Proshares Ultra S&P 500 symbol SSO. Or if you are bearish there is the single bear ETF, Proshares short S&P 500 symbol SH, or the double bear Proshares Ultrashort S&P 500 symbol SDS. Be cautious and understand what you are buying.
Shawn C. Allen, CFA, CMA, MBA, P.Eng.
President, InvestorsFriend Inc.
Updated February 17, 2026
Dear reader: Consider joining our free newsletter list to keep in touch. I hope you will agree that my content is clear, trustworthy and useful. I will never abuse your email address. I only send out to this list about once a month or less. (The newsletter is targeted mostly to Canadian investors but often has content useful to any investor.)
Past Results from this Analysis.
Before placing any weight on the analysis above, you may be interested to review a summary of the fair values that we calculated in the past and whether or not our long-term analysis provided any hint of the 2008 market crash (Arguably the June 1, 2008 analysis provided some hint, especially for investors that felt that a 9% return was required for which we indicated a fair value of the S&P 500 index was 982 in that case and the index was sitting at 1400).
Keep in mind that with the past analysis we also provided a range of valuations and readers were free to select a different fair valuation from our table above.
The table below shows that our analysis appears to have mostly been too conservative. The ONLY time our analysis saw the S&P 500 as under-valued was near its major low in the Spring of 2009. And indeed, over the following ten years an investor buying the S&P 500 made an abnormally high return (a 13.7% compounded annual gain not counting dividends!).
In general, based on where the S&P 500 is today, this past analysis now looks like it has been too cautious. It usually found the market to be over-valued when in fact investing at the dates indicated for the ten-year period or, if ten years has not passed, until today (February 17, 2026) has provided a decent return in almost all cases. Investing and holding at the dates shown from 2004 through 2007 provided, over the following ten years acceptable but unspectacular returns. Investing and holding at any of the dates since 2009 has provided very good returns – except for November 10, 2021.
| Date of prior calculations | S&P Level at that Date | Fair Value we Calculated | Market appeared: | 10 Year or to date Average Capital Gain Per Year (annualized) | Our apparent performance as of February 17, ’26 with the Index at 6843, or after ten years |
| 13-Oct-24 | 5815 | Significantly Over-valued | 12.8% | Wrong, too conservative | |
| 26-Nov-23 | 4559 | 4234 | moderately over-valued | 20.0% | Wrong, too conservative |
| 27-Nov-22 | 4026 | 3872 | about fair-valued | 17.9% | Wrong, too conservative |
| 10-Nov-21 | 4674 | 3788 | over-valued | 9.3% | Wrong, too conservative |
| 20-Jan-21 | 3848 | 2828 | over-valued | 12.0% | Wrong, too conservative |
| 24-Nov-18 | 2633 | 2241 | over-valued | 14.1% | Wrong, too conservative |
| 25-Mar-18 | 2588 | 2078 | over-valued | 13.1% | Wrong, too conservative |
| 26-Nov-17 | 2602 | 1871 | over-valued | 12.5% | Wrong, too conservative |
| 02-Mar-17 | 2382 | 1692 | over-valued | 12.5% | Wrong, too conservative |
| 12-Mar-16 | 2022 | 1539 | over-valued | 13.0% | Wrong, too conservative |
| 24-Mar-15 | 2100 | 1820 | over-valued | 11.4% | Wrong, too conservative |
| 05-Apr-14 | 1865 | 1676 | over-valued | 10.7% | Wrong, too conservative |
| 14-Nov-13 | 1791 | 1513 | over-valued | 9.6% | Wrong, too conservative |
| 18-May-13 | 1667 | 1396 | over-valued | 9.7% | Wrong, too conservative |
| 24-Feb-13 | 1557 | 1396 | over-valued | 9.8% | Wrong, too conservative |
| 08-Sep-12 | 1438 | 1387 | about fair-valued | 10.8% | Wrong, too conservative |
| 25-Feb-12 | 1366 | 1340 | about fair-valued | 12.1% | Wrong, too conservative |
| 25-Aug-11 | 1159 | 1188 | about fair-valued | 14.5% | Wrong, too conservative |
| 26-Feb-11 | 1320 | 1165 | over-valued | 11.2% | Wrong, too conservative |
| 15-May-10 | 1136 | 944 | over-valued | 9.6% | Wrong, too conservative |
| 05-Aug-09 | 1003 | 886 | over-valued | 11.0% | Wrong, too conservative |
| 20-Feb-09 | 770 | 896 | under-valued | 13.7% | It appears we were correct, the index was very much under-valued on Feb 20, 2009 |
| 05-Oct-08 | 1099 | 991 | over-valued | 10.1% | It appears we were wrong the market has delivered a good ten-year return to those buying in October 2008 |
| 01-Jun-08 | 1400 | 1158 | over-valued | 6.9% | It appears that we were moderately too conservative |
| 25-Mar-08 | 1358 | 1221 | over-valued | 6.7% | It appears that we were moderately too conservative |
| 10-Feb-08 | 1331 | 1388 | about fair-valued | 7.0% | It appears that we were correct |
| 19-Aug-07 | 1446 | 1373 | over-valued | 5.3% | correct given that investors likely expected 6% from capital gains |
| 10-Feb-07 | 1438 | 1295 | over-valued | 4.8% | correct given that investors likely expected 6% from capital gains |
| 09-Sep-06 | 1299 | 1189 | over-valued | 5.3% | correct given that investors likely expected 6% from capital gains |
| 07-Apr-06 | 1295 | 1215 | over-valued | 4.8% | correct given that investors likely expected 6% from capital gains |
| 28-Feb-05 | 1191 | 925 | over-valued | 5.9% | It appears that we were moderately too conservative |
| 04-Sep-04 | 1104 | 961 | over-valued | 6.1% | It appears that we were moderately too conservative |
This analysis attempts to look forward ten years. That’s always difficult to do and subject to much error. The oldest analysis is our September 2004 analysis. At that time we were projecting that the S&P 500 index in September 2014 would be at 1,537 based on a P/E of 16 and that its earnings would grow 5% per year from $59 to $96 and that the dividend would grow from $20 to $33. The projection was intended to be reasonably conservative. The index ended September 2014 at 1,972 which was 28% higher than our projection. The earnings at about $100 turned out be reasonably close while the dividend was then running about 21% higher than predicted. The P/E ratio at 19.5 was 22% higher than our base projection of 16 and higher than the top end of our projection which was a P/E of 18. If the P/E was at the long-term average of about 16 then our S&P 500 projection would have been quite close.
The only time the analysis suggested the market was under-valued on the dates we updated was February 20, 2009 and that turned out to be correct.
1. See Warren Buffett in Fortune Magazine, November 22, 1999, and his updated article of December 10, 2001. The same linking of stock index growth to GDP (or GNP) was made in Buffett’s October 9, 1969 letter to his partners.