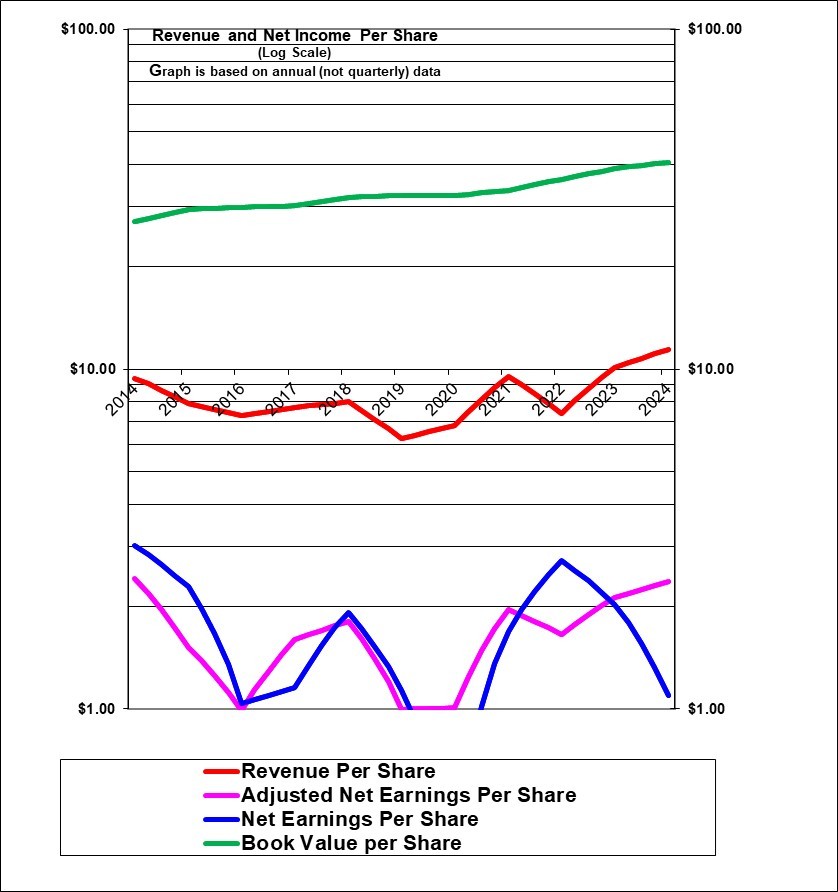
Melcor’s revenue per share (red line) had mostly trended down since 2014 but increased in 2023 and 2024.
(Adjusted) earnings per share have been quite volatile but always positive on an annual basis and in 2024 were at thje same level as 2014. Part of the explanation for that is that 2024 was a cycliuc high driven by Alberta’s strong economy at that time when oil prices were higher. The company is quite cyclical.
Book value per share has trended up modestly over the years. Recently it was boosted by share buy backs at prices far below book value.
Overall this is certainly not an impressive chart.
| Melcor Developments Ltd. (MRD, Toronto) | |
| RESEARCH SUMMARY | |
| Report Author(s): | InvestorsFriend Inc. Analyst(s) |
| Author(s)’ disclosure of share ownership: | Author(s) hold shares |
| Based on financials from: | Dec ’24 Y.E. |
| Last updated: | March 30, 2025 |
| Share Price At Date of Last Update: | $ 12.46 |
| Currency: | Canadian $ |
| Generic Rating (This rating does not consider the circumstances of any individual investor and is therefore not specific advice for any individual): | Buy at $12.46 |
| Qualifies as a stock that could be bought with confidence to hold for 20 years? | Yes but expect only modest and below market returns |
| Has Wonderful Economics? | No |
| Has Excellent and Trustworthy Management? | No |
| Likely to grow earnings per share at an attractive rate over the next decade? | Expect modest but not attractive growth |
| Positive near-term earnings outlook? | Yes, probably |
| Valuation? | Attractive |
| SUMMARY AND RATING: The graph of adjusted earnings per share demonstrates essentially no growth and some volatility going back ten years. Not impressive – although, in fairness, 2014 represented a cyclic peak as Alberta boomed with high oil prices. Book value per share has grown at an average of 4.1% annually since 2014 including fair value gains (and since 2020 fair value losses) on its rental buildings. This together with the dividend that averaged about 2% of book value suggests an achieved average effective ROE of around 6.1%. In 2024, the adjusted ROE was once again weak at 5.9% and also relatively weak at 7.7% if calculated using Funds from Operations, FFO. Overall the economics of the business have not been good as it appears that the gross profits on lot prices have not been high enough to reflect all the years that equity is tied up before the sale. With quite cyclical or volatile earnings, the earnings-related and other value ratios are somewhat unreliable but would currently suggest a Buy or higher rating based on the price to book ratio of 30% and the P/E of 5.2 but tempered by the weak ROE. The outlook for lot sales appears good as home starts are strong in Alberta. The outlook for the commercial rental building segment is for stability with probably no near-term material improvement. The buy-in of the REIT at $5.50 per unit simplifies the business and could lead to the dividend being at least partly restored. Management quality and their level of ambition to improve things is questionable at best. The controlling family appears to have little regard for increasing the share price. The insider trading signal is neutral. It’s not entirely clear that they have any lasting competitive advantage although they have strong market knowledge and abilities in a field that is probably not that easy to enter for new competitors (but why would anyone want to enter?). The balance sheet is relatively strong. And interest expenses are relatively large as a percentage of earnings. Note the thin trading liquidity. Overall we rate this a Buy at this time based on the extremely low price to book value and the nature of the assets but tempered by the low ROE history and the apparent complacency of management. We acknowledge that it has been a poor investment for many years except when purchased after very steep price drops which occurred with the financial crisis in 2008 and with the pandemic in 2020 and which seemingly is occurring again at this time. In the longer term we would like to see a substantial share price gain which would be an opportunity to exit this apparently inherently low return business. A catalyst for a price increase would be an increase to the dividend after the REIT is taken private. | |
| MACRO ENVIRONMENT: Alberta continues to benefit from a population surge which has led to a record pace of home building. The Alberta economy appears set to remain strong in 2025. Higher interest rates have been a headwind but this has improved more recently. | |
| LONG TERM VALUE CREATION: On its books at least, Melcor has created significant long-term value given that 91% of its equity consists of retained earnings and the company has also paid out substantial dividends. However, the market has shaved off much of the accounting value as the shares trade at only about 30% of accounting book value whereas the vast majority of publicly traded companies trade at a higher price than book value. And it’s not clear that the ROE has been attractive at all in the long term. Recent value creation has been poor. | |
| DESCRIPTION OF BUSINESS: Updated March 2025 based on 2024 figures. The contributions of its various segments to revenue and earnings varies significantly from year to year. In 2024, 64% of revenue was as a residential (with some commercial) land developer. The land development business appears to be largely done with joint venture partners. Rents out office, retail and industrial buildings including some in a 55% owned REIT structure – but will soon buy in the 45% that trades publicly (33% of revenue). Also owns and operates three golf courses and has an interest in a fourth (3% of revenue). Operates mostly in or near the major cities of Alberta. Has some U.S. residential developments (Phoenix and Denver totaling 12% of land inventory) and rental property included in the segments above). The rental investment property portfolio totals about 57 buildings or properties and 4.76 million square feet . Tenants include the Alberta government, Canadian Tire, Canadian Western Bank, Home Depot, Rexall Drugs, Rona, Royal Bank, Save-on Foods, Sobeys, Scotia Bank, Shoppers Drug Mart, Sport Chek, Staples, TD Canada Trust, Tim Hortons, Walmart and many others. Buildings include 452 residential apartment units (including apparently 60 units in Scottsdale that can be sold as individual units) and 11 parking lots. The total assets are $2109 million. Melcor is not employee intensive as it contracts out the physical work of developing properties. 13% of the assets are in the U.S. and the great majority of the Canadian assets are in Alberta. The U.S. assets appear to be mostly represented by about six office buildings purchased from 2014 to 2016 as well as over 1000 acres of largely residential development lands in Arizona and Colorado. | |
| ECONOMICS OF THE BUSINESS: The largest business is residential (and some commercial) land development. In this business they buy (and hold for a long time) raw land typically on the edges of cities, mostly in Alberta but with some in Kelowna and some near Denver Colorado and other areas in the western U.S. In this business capital spending, unlike the case for most companies, goes directly into the product that is sold, so that capital is recycled although the process can easily take 10 years or more. Developing the land into residential building lots (and some multi-family and shopping areas) requires extensive engineering plans and designs and certain environmental studies, obtaining permits and installing infrastructure such as roads and utilities (which is done through contractors). Also there is substantial surveying and grading (which also is done by contractors). This business involves investing for a number of years before any lots can be sold (if ever). There is competition. The business can be highly cyclical and unpredictable. However gross margins on lots and land sales have been too low since 2015 and this has led to an inadequate overall company ROE in the 3 to 6% range. Due to long holding periods for land, a higher gross margin is required in order achieve a reasonable ROE on money invested over the years. Another portion of the business is to manage the construction (by contractors) of commercial, retail and industrial rental buildings. The economics have been such that Melcor has been able to make good profits on this business. The third major area of business is renting out the commercial and retail space. This portion of the business has generated modest but steady rental returns plus mostly increases in the market value of the rental properties as interest rates have declined – but in 2020 and since then building values declined due to higher vacancies. Overall it appears that Melcor’s business economics have been relatively poor since 2014. Unfortunately, there is not much reason to expect the ROE to reach double digits much less to be sustained at that level. | |
| RISKS: The primary risk is the state of the Alberta economy and the volatile demand for new housing (and potentially lower prices for building lots) and the demand and market rents for its office and retail space. There is some risk that demand for its office space has relatively permanently decreased due to the work from home phenomenon and due to an excess supply of office space on the market. Another risk is the risk from higher interest rates which, all else equal, would lower the market value of its buildings and land as well as lower reported earnings but as of Q1 2025 that risk has abated somewhat. There is some risk of bad debts from builders although apparently they retain title to building lots until they are paid for. See annual report for additional risks. Also, this public company has a majority controlling owner. In most cases this will benefit outside shareholders as compared to non-ownership type management. But there is a risk that the controlling shareholder will use his position to award large bonuses and stock option grants to himself and the family and not act strictly in the best interest of outsiders. The family may have little interest in the share price since they apparently have no intention of selling. The family may even prefer a lower share price to limit any capital gains tax in transferring the business to the next generation. This family control feature can tend to hold the share price down somewhat (perhaps significantly) since it seems to preclude any possibility of a take-over bid no matter how low the share price is. | |
| INSIDER TRADING / INSIDER HOLDING: Checking from April 1, 2024 to March 30, 2025. There was a modest amount of both buying and selling by insiders. The overall insider trading signal is neutral. The company itself has been buying back shares regularly but is limited to a small amount per day due to the low trading liquidity. | |
| WARREN BUFFETT’s CRITERIA: Buffett indicates that all investments must pass four key tests: the business is simple to understand (marginal pass as the accounting is complex and the business very cyclical), has favorable long-term economics due to cost advantages or superior brand power (fail – it appears to be involved in an inherently low ROE businesses – its land development business appears to be both low return and high risk), apparently able and trustworthy management (fail given the weak recent performance and apparent lack of concern for the public share owners), a sensible price – below its intrinsic value (pass – low P/E and apparently selling well below market value of assets but tempered by the low ROE), Other criteria that have been attributed to Buffett include: a low debt ratio (pass), good recent profit history (fail) little chance of permanent loss of the investors capital (pass) a low level of maintenance type capital spending required to maintain existing operations excluding growth (pass) | |
| MOST RECENT EARNINGS AND SALES TREND: This company has volatile and cyclic earnings and various accounting issues that make the adjusted earnings highly variable. Revenues per share in the past four quarters starting with the most recent (Q4 2024) were up 38%, down 32%, up 9%, and up 41%. In the same four quarters, adjusted earnings per share were (too volatile to bother listing). In 2024 overall, revenues per share were up 12% and adjusted earnings per share were up 11%. In 2023 overall, revenues per share were up 37% and adjusted earnings per share were up 28%. In 2022 revenues per share were down 22% and adjusted earnings per share were down 15%. In 2021, revenues per share and adjusted earnings were up substantially but that is in comparison to a very weak 2020. The graph shows a negative trend in revenues and earnings per share dating back to 2014 (when oil prices fell). | |
| INDUSTRY SPECIFIC STATISTICS: The gross profit on lot sales remains too low (given the number of years the investment was tied up) at about 329%. In 2024, residential lot sales in Canada were up 13% and average lot prices were up 10% to $187,000. There were no lot sales in the U.S. Residential. Lot sales in Canada in 2023 were up by 8% driven by a surge in lot sales in Q4. And, overall counting U.S. lot sales the increase was 30%. Canadian lot prices in 2023 were up 10% to $170,000. (This can very based on lot sizes and the percent of estate lots) Lot prices on average in 2022 were up 6% to $154,000. | |
| Earnings Growth Scenario and Justifiable P/E: The trailing P/E is generally not a reliable indicator for this cyclic company but at 5.2 it is certainly not pricing in much if any growth. | |
| VALUE RATIOS: Analysed at a price of $12.46. The Price to book value ratio appears extremely attractive indeed at 0.30 (30 cents on the dollar!) especially considering the “hard” and tangible nature of its assets. However note that the shares have a history of usually trading somewhat (though usually not this much) under book value. It also seems possible that Melcor will continue to earn a low ROE on its land investments due to the many years that investments are tied up before selling the developed land. And its rental buildings could continue to suffer market value losses due to interest rates and due to vacancies in the office buildings. And we also have to consider the poor (adjusted earnings) ROE at 5.9% and that it has been consistently quite poor since 2014. Under IFRS accounting, investment properties have been marked to (modeled) market value but land (other than under rental buildings) remains valued at cost (including costs of improvements and capitalised interest) unless there is an impairment which has not occurred in recent decades. The dividend yield is reasonably attractive(despite the cut) at 3.5%. The payout ratio is just 18% of trailing adjusted earnings. The interim adjusted P/E appears highly attractive at 5.2 but is not very meaningful given the cyclical nature of the business. Earnings will vary significantly with lot and other land sales in Alberta and the U.S. Book value per share is $40.92 Overall the value ratios (in isolation) easily support a Buy or even Strong Buy rating on the basis of buying dollar bills (the book value) for about 30 cents although the very low ROE and the poor recent history offsets that. (It may be that the book value is stuck in an inherently poor ROE business with weak management.) On an enterprise basis if the company were acquired including its debt the price appears to represent buying assets at 53 cents on the dollar of book value. | |
| TAXATION: Nothing unusual. The dividend qualifies for the Canadian dividend tax credit. | |
| SUPPORTING RESEARCH AND ANALYSIS | |
| Symbol and Exchange: | MRD, Toronto |
| Currency: | Canadian $ |
| Contact: | ir@melcor.ca |
| Web-site: | www.melcor.ca |
| INCOME AND PRICE / EARNINGS RATIO ANALYSIS | |
| Latest four quarters annual sales $ millions: | $349.5 |
| Latest four quarters annual earnings $ millions: | $33.5 |
| P/E ratio based on latest four quarters earnings: | 11.4 |
| Latest four quarters annual earnings, adjusted, $ millions: | $72.7 |
| BASIS OR SOURCE OF ADJUSTED EARNINGS: We have removed the after tax gains (and more recently losses) on market value of buildings that the company must report under International Financial Accounting Standards. Also adjusted for the changes in the value of the REIT units which flow into earnings, and unusual income tax items. Note that earnings are cyclical and heavily dependent on economic activity. There have been some unusual gains on asset sales but we have generally not adjusted for these due to the overall cyclical nature of the company and the difficulty of obtaining a normalized view of earnings. | |
| Quality of Earnings Measurement and Persistence: Lower measurement quality and lower persistence quality. Earnings result from sales of developed residential building lots and some commercial lots at a profit, value added in developing rental buildings, rental income, and from the mark to market gains (or losses) on investment properties and occasional sale of rental property (though we adjust for the market value gains or losses). Builders often have about 1 year to pay for the lots and there is some risk of bad debt although that receivable is secured by the lots sold. Earnings are quite cyclic so they are not very predictable. However we removed the mark to market gains for adjusted earnings and so adjusted earnings are of reasonably good measurement quality but remain cyclically volatile. | |
| P/E ratio based on latest four quarters earnings, adjusted | 5.2 |
| Latest fiscal year annual earnings: | $33.5 |
| P/E ratio based on latest fiscal year earnings: | 11.4 |
| Fiscal earnings adjusted: | $72.7 |
| P/E ratio for fiscal earnings adjusted: | 5.2 |
| Latest four quarters profit as percent of sales | 20.8% |
| Dividend Yield: | 3.5% |
| Price / Sales Ratio | 1.09 |
| BALANCE SHEET ITEMS | |
| Price to (diluted) book value ratio: | 0.30 |
| Balance Sheet: (Last updated Q3 ’23). Assets are comprised as follows: 52% of the assets are investment properties which are marked to (modeled) market (and a further 3% are mostly tenant incentives and similar). 36% of the assets are represented by the land inventory (which would be land cost plus subsequent costs of developing the land and plus capitalized interest – this is not marked to market). 4% of assets is largely a large and somewhat longer term secured receivable from builders who apparently pay for lots only after one year and in some cases longer. Melcor retains title to the lots until payment is received. No interest applies until one year passes and then prime plus 2% interest applies. 3% of assets is cash. Property and equipment accounts for less than 1% of assets which illustrates the fact that this is a company that manages land development by contracting out that work. On the liability side of the balance sheet, 56% of the assets are supported by common equity, 33% by debt, 3% by a provision for land development costs, (Only) 3% by the minority interest of the REIT (the publicly traded share of the REIT) 3% by deferred income taxes and 3% by accounts payable. 91% of the common equity is retained earnings which proves that it has a history of making profits especially considering that substantial additional earnings were dividend out over the years. (However, the market is discounting the equity by 71% as if the earnings were not “real”). There is no purchased goodwill. Deferred income taxes owing can be considered a softer liability in that it may continue to grow and be deferred for years (even as deferred taxes are paid, new deferred taxes may take their place in which case there is no net cash paid out on deferred taxes). Overall, this appears to be a very strong balance sheet with hard and valuable assets financed with relatively modest debt. However, with the market discounting the book equity by 71% and the enterprise value by 45% there comes a point where we have to question if the book asset values are realistic. | |
| Quality of Net Assets and Book Value Measurement: This should be high although real estate assets are subject to possibly significant market value fluctuation. See our comments about the balance sheet. As of March 30, 2025 the shares traded at just 30% of book value. Investment properties have been marked up to (modeled) market value (and since 2020 marked down somewhat). The land inventory remains valued at cost (including development costs and capitalized interest) and it seems likely that land market values are somewhat above book value, but the actual ratio is unknown and subject to change including declines. The company attested that as of December 31, 2023 the (UNDISCOUNTED) realizable value of its land inventory was higher than its carrying value such that no provision for impairment was required. But that does not mean that the market value is higher than cost. There is also presumably value in the going concern aspect of the business beyond its asset value. Overall the quality of the assets and the book value measurement seems high. However, it may be that the land assets in particular are trapped in a low return business and that the investment properties may be over-valued on the books in light of higher interest rates. | |
| Number of Diluted common shares in millions: | 30.4 |
| Controlling Shareholder: Timothy C. Melton, the chairman of the company, together with his family, controls about 55% of the shares. A former CEO and current board member owns another 4% and other directors/officers total about 1%. It appears that about 40% of the shares are available to trade however there are some other large holders as well. | |
| Market Equity Capitalization (Value) $ millions: | $378.8 |
| Percentage of assets supported by common equity: (remainder is debt or other liabilities) | 58.9% |
| Interest-bearing debt as a percentage of common equity | 49% |
| Current assets / current liabilities: | not available |
| Liquidity and capital structure: Apparently reasonably good liquidity but they are dependent on continued access to bank credit, the company does use debt to finance their investment properties and (to a very limited degree) raw and developed land but the debt is probably not excessive and was recently 49% of the book value equity amount which is relatively low leverage. However with the equity trading at 30% of book value, debt is significantly higher than the market value of equity. It does have debt maturities coming up but these are mostly secured against individual buildings or land with no recourse to Melcor. | |
| RETURN ON EQUITY AND ON MARKET VALUE | |
| Latest four quarters adjusted (if applicable) net income return on average equity: | 5.9% |
| Latest fiscal year adjusted (if applicable) net income return on average equity: | 5.9% |
| Adjusted (if applicable) latest four quarters return on market capitalization: | 19.2% |
| GROWTH RATIOS, OUTLOOK and CALCULATED INTRINSIC VALUE PER SHARE | |
| 5 years compounded growth in sales/share | 12.8% |
| Volatility of sales growth per share: | Good long term growth with significant volatility. |
| 5 Years compounded growth in earnings/share | -0.7% |
| 5 years compounded growth in adjusted earnings per share | 18.9% |
| Volatility of earnings growth: | Highly volatile but always positive each year |
| Projected current year earnings $millions: | not available |
| Management projected price to earnings ratio: | not available |
| Over the last ten years, has this been a truly excellent company exhibiting strong and steady growth in revenues per share and in (adjusted) earnings per share? | no |
| Expected growth in EPS based on adjusted fiscal Return on equity times percent of earnings retained: | 4.8% |
| More conservative estimate of compounded growth in earnings per share over the forecast period: | 0.0% |
| More optimistic estimate of compounded growth in earnings per share over the forecast period: | 8.0% |
| GROWTH OUTLOOK AND AMBITIONS: Melcor appears set for a reasonably strong year in 2025 driven by lot sales which are in turn driving by a growing p[population and Alberta’s strong economy. They see potential for improved land sales in the U.S. Interest rates have declined somewhat which is beneficial. The acquisition of the public minority interest in the REIT will simplify corporate reporting. It could also potentially lead to the dividend being restored to as high as about 16 cents quarterly (a 5.1% yield at the current price) but if so would not likely happen before August. After several years of fair value losses on investment properties due to higher interest rates and vacancies, there may be minimal or no net fair value losses in 2025. | |
| LONG TERM PREDICTABILITY: While earnings are highly unpredictable in the short term, it seems safe to assume the company will continue to grow over the decades. The question is whether this will be at a good or even adequate return on equity. Currently the return on equity is unacceptably low although the return on market value of equity (the depressed share price) is quite good. | |
| Estimated present value per share: This company is quite cyclical is therefore difficult to value based on earnings. It seems clear that the intrinsic value is somewhat higher than the recent $12.46 share price. Consider that book value is $40.92 per share. Even if book value over-states the true intrinsic value, there would appear to be a large margin of safety here. However, it may be that the book value is stuck invested in a fundamentally low return business. | |
| ADDITIONAL COMMENTS | |
| INDUSTRY ATTRACTIVENESS: (These comments reflect the industry and the company’s particular incumbent position within that industry segment.) Michael Porter of Harvard argues that an attractive industry is one where firms are somewhat protected from competition. The development industry probably has limited barriers to entry – although scale, financing and industry knowledge may provide some barrier (marginal pass). There are no known issues with powerful suppliers although governments may play a restricting role and they may be dependent on key contractors though we have no information on this (pass). No issues with excessive dependence on powerful customers (pass although there may be some vulnerability to a few key home builders), No viable substitute products (pass), Probably at least some tendency to compete excessively on the basis of price (marginal pass). Overall this industry appears to be only neutral at best in attractiveness. | |
| COMPETITIVE ADVANTAGE: Established presence in the market place and knowledge. Relationships with contractors who build its buildings and do the physical development of land. Has an existing inventory of land which overall was probably purchased on average at prices somewhat below the recent market value, although we may be wrong on that as market values may have decreased. Based on the low ROE it does not appear that they truly have any competitive advantages. | |
| COMPETITIVE POSITION: Its not clear what market share Melcor Developments has but it is a fragmented market and they likely have well under a 10% share for the Province. | |
| RECENT EVENTS: The company is in the process of buying out the publicly traded units of its REIT subsidiary. The cost will be approximately $72 million plus transaction fees. In February 2025 the REIT disposed on a shopping center for $48 million in order to raise cash. In 2024 the REIT sold 2 smaller properties also to raise cash. In March 2024, with the 2024 earnings release, Melcor rather inexplicably cut the dividend by 31% from 16 cents to 11 cents while providing no discussion on the reasons for this but it apparently related to the suspension of the REIT distribution. In February 2024 its REIT subsidiary suspended its distribution and announced it would undertake a strategic review. This review has culminated in the REIT being taken private by Melcor as its parent. | |
| ACCOUNTING AND DISCLOSURE ISSUES: Book value per share may over-state the true market value of its assets. Land is valued at cost but may not be worth cost if a discounted future cashflow analysis is used. Under IFRS accounting, the company (paradoxically) reports a gain when the value of the units in its separately-traded REIT decline. This is preposterous and we add it back. The company also adds it back to concentrate on Funds From Operations. Also under IFRS its gains and losses on the (modeled) market value of its rental buildings flow directly into earnings. We adjust for that. With the stock trading well below book value it is important to understand the assets and their accounting value. The capitalized interest included in its raw land costs would be a useful figure but does not appear to be disclosed. The accumulated mark-to market gains on its rental buildings would be useful but are not disclosed. The age of all its buildings would be useful but is not disclosed. Under IFRS the value of its investment properties have been written up to market (and more recently written down) but the development land inventory remains stated at cost and the market value of the land does not appear to be disclosed. The past writing up of the buildings to market value pushes up book value and pushes down the ROE. There is not much explanation of the nature of operating lease incentives or straight line rent adjustments. Other complexities include the nature of the provision for future development costs and the nature of the deferred income taxes and whether that might be expected to reverse. Overall it appears that “the market” has a difficult time understanding the accounting and economics of the company. | |
| COMMON SHARE STRUCTURE USED: Normal, 1 vote per share | |
| MANAGEMENT QUALITY: Management quality does not appear to be good – the recent level of profitability has been inadequate and, what’s worse, management seems relatively unconcerned by the situation. The CEO Chairman claims that most aspects of its profitability are outside of its control and that there is no point in providing more incentive for top management to increase profits. And based on their responses to questions it is not clear that they even understand that their gross margin on land sales has been too low. There are some indications that they are not good at controlling the costs of land development. And we do have some concerns that the disclosure could be improved in terms of clarity. And there is a total lack of guidance on outlook. The CEOs historically have been promoted from within which is a sign of good management. Management has seemed completely unconcerned about the fact that the share price has been for several years trading at significantly less than half (and more recently less than one-third) of book value. Their role of stewards of the capital invested by public share owners seems questionable. They are protecting that capital but not earning an attractive or even reasonable or adequate return on it. | |
| Capital Allocation Skills: Based on accounting results, this is now very questionable given the poor ROE in recent years. Results about 15 years ago were far better. On occasion it has bought back shares at good prices. The creation of the REIT in 2013 appeared to have been a prudent move. However the stock market for the past few years seems to disagree that the capital investments were wise given that it is valuing the equity at now just 30% of book value! It is now questionable as to whether their investments in land have in fact been a good allocation of capital. They likely invested too much in land that would not be developed for many years or even decades. | |
| EXECUTIVE COMPENSATION: Updated from the Spring 2024 circular with 2023 compensation: The CEO who is also the chair and the senior member of the controlling family was compensated was compensated at about $1.3 million relatively similar to the prior two years. The CFO/Chief Operating Officer was compensated at $1.2 million, relatively similar to the prior two years. The remaining three executives were compensated at $0.45 to $0.5 million. The compensation for the top two could be considered excessive for such a low ROE company that had adjusted earnings of $66 million 2023 and FFO of $84 million. We also note that in comparing total executive compensation to performance the company focuses on asset and book value growth and dividends per share but not return on assets or return on equity or total shareholder return (They did show the share performance was below the TSX and TSX real Estate index.) | |
| BOARD OF DIRECTORS: (Updated from Spring 2023 circular) A small with board with 8 members. Several key members own large stock holdings which aligns their interests with that of outside shareholders. Three members are from the controlling owner Melton family. We understand that unfortunately 4 of the other 5 can be described as friends of the family. Three of the outside directors own very few shares. Therefore this is a weak Board when it comes to the interests of the public share owners. | |
| Basis and Limitations of Analysis: The following applies to all the companies rated. Conclusions are based largely on achieved earnings, balance sheet strength, achieved earnings per share growth trend and industry attractiveness. We undertake a relatively detailed analysis of the published financial statements including growth per share trends and our general view of the industry attractiveness and the company’s growth prospects. Despite this diligence our analysis is subject to limitations including the following examples. We have not met with management or discussed the long term earnings growth prospects with management. We have not reviewed all press releases. We typically have no special expertise or knowledge of the industry. | |
| DISCLAIMER: All stock ratings presented are “generic” in nature and do not take into account the unique circumstances and risk tolerance and risk capacity of any individual. The information presented is not a recommendation for any individual to buy or sell any security. The authors are not registered investment advisors and the information presented is not to be considered investment advice to any individual. The reader should consult a registered investment advisor or registered dealer prior to making any investment decision. For ease of writing style the newsletter and articles are often written in the first person. But, legally speaking, all information and opinions are provided by InvestorsFriend Inc. and not by the authors as individuals. The author(s) of this report may have a position, as disclosed in each report. The authors’ positions may subsequently change without notice. | |
| © Copyright: InvestorsFriend Inc. 1999 – 2025. All rights to format and content are reserved. | |