lululemon athletic inc.
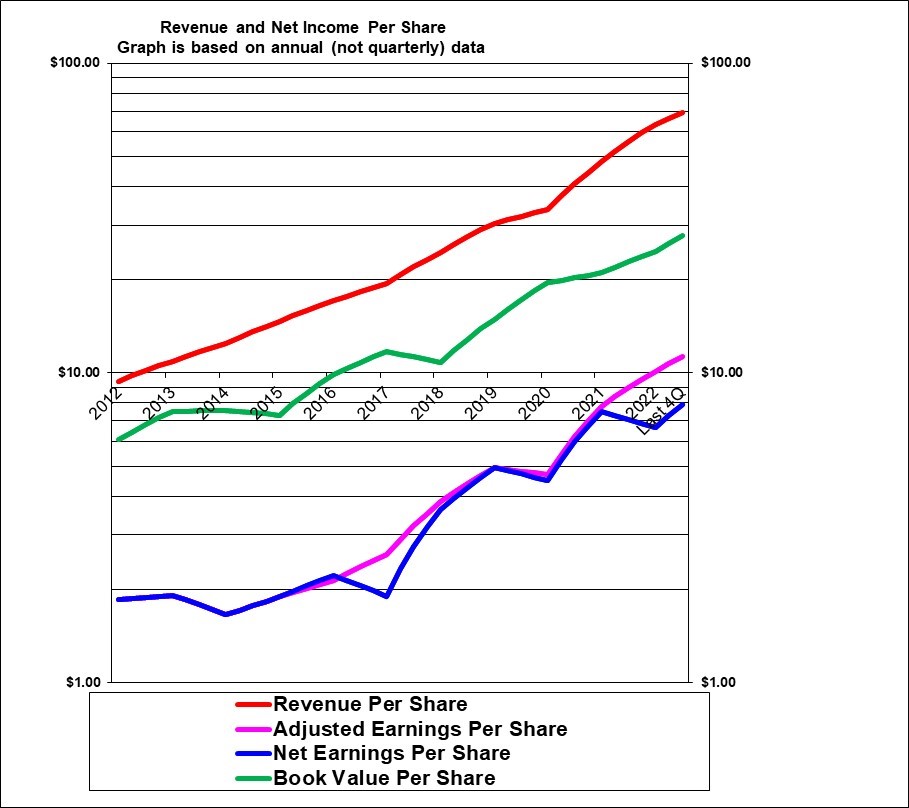
This graph is a thing of beauty! Revenues and earnings per share have increased at a very high rate in the 10 years shown – with only a modest drop in earnings in 2020 due to the pandemic and a very strong rebound since then. This has been a very successful and high growth company.
|
lululemon athletica inc. (lulu, NASDAQ) |
|
|
RESEARCH SUMMARY |
|
|
Report Author(s): |
InvestorsFriend Inc. Analyst(s) |
|
Author(s)’ disclosure of share ownership: |
The Author(s) holds shares |
|
Based on financials from: |
2022 Y.E. +Q2 ’22 |
|
Last updated: |
August 26, 2023 |
|
Share Price At Date of Last Update: |
$ 396.00 |
|
Currency: |
$ U.S. |
|
Generic Rating (This rating does not consider the circumstances of any individual investor and is therefore not specific advice for any individual): |
Speculative Buy at $396 |
|
Qualifies as a stock that could be bought with confidence to hold for 20 years? |
Probably, yes |
|
Has Wonderful Economics? |
Yes |
|
Has Excellent and Trustworthy Management? |
Yes |
|
Likely to grow earnings per share at an attractive rate over the next decade? |
Yes |
|
Positive near-term earnings outlook? |
Yes |
|
Valuation? |
Expensive |
|
SUMMARY AND RATING: The graph of revenues per share as well as earnings per share shows very strong and steady growth with only a modest decline in earnings with the pandemic in 2020 followed by stellar growth since then. Book value per share has also increased sharply over the years. The Value ratios would indicate rating of probably Hold to Speculative Buy given the high P/E ratio offset by the very good ROE and growth. Management quality appears strong. The insider trading signal is neutral. Executive compensation is generous but not of any real concern. The profit and sales outlook is for lower growth but still quite likely in at least the low double digits percent.. The economics of the business are extremely good as evidenced by the high gross margins and high net profit and ROE. It has a competitive advantage in its strong brand position and proprietary produces that allows it to sell at high margins. Overall we would rate this as a Speculative Buy. But be aware that it will not be immune if a recession develops. We would be more interested at a price of $350 or lower. |
|
|
MACRO ENVIRONMENT: A potential recession would be a headwind. While spending at lululemon has continued to grow a recession would lower its growth. |
|
|
LONG TERM VALUE CREATION: Has been very strong. |
|
|
DESCRIPTION OF BUSINESS: lululemon is “a designer, distributor, and retailer of healthy lifestyle inspired athletic apparel (clothing) and accessories. It contracts out the manufacturing. While head office is in Vancouver and its design activities are headquartered there, lululemon should be considered to be an American retailer/designer with a significant international presence. As of January 2022 it had 574 company-operated stores in 17 countries. The locations of the stores was 56% in the U.S.A., 15% (86 stores) in China, 11% in Canada, 5% Australia, 3% United Kingdom and 9% spread over 12 countries. Essentially all of its locations are leased and not owned. In addition it had 37 wholesale outlets mostly in North America. In 2021, 45% of revenue was from the “direct to consumer” channel (online sales) and, 45% from company-operated stores and 11% was from other which includes its MIRROR online fitness business, wholesale sales to yoga studios and other fitness centers as well as several licenced retailers in Mexico and the Middle East and also about 45 seasonal stores in operation during the holiday season. 48% of its fabrics come from Taiwan and 19% from mainland China and 11% from Sri Lanka. Most of its products are manufactured in Asia (40% Vietnam, 17% Cambodia, 11% Sri Lanka and 7% in China). The average store size if 3030 square feet or the equivalent of 55 feet by 55 feet. There are about 29,000 employees, 57% located in the U.S., 26% in Canada and 17% in other countries. In 2021, 67% of revenue was from women’s wear. In 2021 85% of revenue was from North America. |
|
|
ECONOMICS OF THE BUSINESS: The economics are extremely strong with a 59% gross margin in Q2 2023 and with a 16% bottom line profit on sales in the last 12 months and an extremely strong ROE of 45%. |
|
|
RISKS: See annual report for a discussion of risks. In our view the major risk is to maintain and build customer loyalty in North America and other countries. While every company faces risks, this does not strike us as a particularly risky company in terms of its future earnings. |
|
|
INSIDER TRADING / INSIDER HOLDING: There has been very little recent insider trading. One director sold a modest amount in September 2022 at $352 and an executive sold a substantial amount in late May 2023 at $362. Overall, with not much trading the insider trading signal is neutral. |
|
|
WARREN BUFFETT’s CRITERIA: Buffett indicates that all investments must pass four key tests: the business is simple to understand and predict (pass), has favorable long-term economics due to cost advantages or superior brand power (pass given ROE and brand power), apparently able and trustworthy management (pass), a sensible price – below its intrinsic value (marginal pass), Other criteria that have been attributed to Buffett include: a low debt ratio (pass – no debt), good recent profit history (pass) little chance of permanent loss of the investors capital (pass) a low level of maintenance type capital spending required to maintain existing operations excluding growth (pass). |
|
|
MOST RECENT EARNINGS AND SALES TREND: Revenue per share growth in the past four quarters, beginning with the most recent (Q2 fiscal 2023 which ended July 30, 2023) was 19%, 25%, 32% and 30%. Revenues per share in fiscal 2022 ended January 29, 2023 were up 32%. Revenues per share in 2021 were up 43%. Revenues per share in 2020 were up 11% despite the pandemic and the growth in 2019 was 24%. Adjusted earnings per share in the past four quarters and going back was 22%, 53%, 29% and 26%. The increase in fiscal 2022 was 30%. The increase in 2021 was 65%. The overall decline in 2020 was 5% and in 2019 the growth was 28%. Overall, lululemon has extremely strong history of growth. |
|
|
COMPARABLE STORE SALES OR INDUSTRY SPECIFIC STATISTICS: Same store sales growth in the past four quarters beginning with the most recent was strong at 7%, 13%, 15%, and 14%. (The somewhat lower result in the most recent quarter however is a possible sign of lower growth ahead). Comparable store sales in fiscal 2022 were 16%. Direct to consumer (online) sales growth in the past four quarters going back was 15%, 16%, 37%! and 31%!. |
|
|
Earnings Growth Scenario and Justifiable P/E: The current P/E of about 35 trailing adjusted earnings is pricing in strong double digit earnings growth for at least several years. |
|
|
VALUE RATIOS: The price to book value ratio is unattractively very high at over 14 times – but this is not a very relevant value ratio for this company and may be justified by the very high ROE – still, it is an indication that the stock is not cheap. The trailing adjusted earnings P/E ratio is very high at 35 and is going to require continued very high growth to justify that price. The trailing year ROE is extremely strong at 45%. There is no dividend. Revenue per share growth in the past five fiscal years has averaged 27% and earnings per share growth has averaged 31%. The intrinsic value of the shares is calculated at $311 assuming five year growth will average 14% and the P/E will decline to 20 and $424 for 16% growth and a terminal P/E of 25. Overall, while the ROE is proof that this is an extremely profitable company, the stock is pricing in continued strong growth suggesting a rating of perhaps Hold to Speculative Buy. |
|
|
TAXATION: Despite being headquartered in Canada, this is a U.S. registered company. It is foreign property for Canadians. With no dividend, the taxation for Canadians will be on the capital gain or loss translated to Canadian dollars. |
|
|
SUPPORTING RESEARCH AND ANALYSIS |
|
|
Symbol and Exchange: |
Lululemon Athletica Inc. |
|
Currency: |
$ U.S. |
|
Contact: |
604-732-6124 |
|
Web-site: |
www.lululemon.com |
|
INCOME AND PRICE / EARNINGS RATIO ANALYSIS |
|
|
Latest four quarters annual sales $ millions: |
$8,838.7 |
|
Latest four quarters annual earnings $ millions: |
$1,007.3 |
|
P/E ratio based on latest four quarters earnings: |
50.2 |
|
Latest four quarters annual earnings, adjusted, $ millions: |
$1,445.9 |
|
BASIS OR SOURCE OF ADJUSTED EARNINGS: Starting in 2020 we add back amortisation and acquisition-related expenses net of an assumed income tax impact. Previously, adjusted earnings were as reported by management. In Q2 of fiscal 2022 deducted the gain on a sale of a building. |
|
|
Quality of Earnings Measurement and Persistence: High quality. |
|
|
P/E ratio based on latest four quarters earnings, adjusted |
35.0 |
|
Latest fiscal year annual earnings: |
$854.8 |
|
P/E ratio based on latest fiscal year earnings: |
59.1 |
|
Fiscal earnings adjusted: |
$1,297.0 |
|
P/E ratio for fiscal earnings adjusted: |
39.0 |
|
Latest four quarters profit as percent of sales |
16.4% |
|
Dividend Yield: |
0.0% |
|
Price / Sales Ratio |
5.72 |
|
BALANCE SHEET ITEMS |
|
|
Price to (diluted) book value ratio: |
14.26 |
|
Balance Sheet: The balance sheet is strong with no debt and a large cash position. |
|
|
Quality of Net Assets (Book Equity Value) Measurement: High quality, but not relevant given the large multiple to book value. |
|
|
Number of Diluted common shares in millions: |
127.3 |
|
Controlling Shareholder: (Updated 2022) Founder Dennis (Chip) Wilson owns 8.6% – he is no longer a Board member or executive. One investment fund (and/or its unit holders) owns 14.6% and Vanguard (and /or its unit holders) owns 5.4% of the shares. Several other funds hold very large positions as well. Management and directors as a group own less than 1%. |
|
|
Market Equity Capitalization (Value) $ millions: |
$50,396.1 |
|
Percentage of assets supported by common equity: (remainder is debt or other liabilities) |
59.0% |
|
Interest-bearing debt as a percentage of common equity |
0% |
|
Current assets / current liabilities: |
2.4 |
|
Liquidity and capital structure: With no debt, the liquidity and capital structure is strong. |
|
|
RETURN ON EQUITY AND ON MARKET VALUE |
|
|
Latest four quarters adjusted (if applicable) net income return on average equity: |
45.2% |
|
Latest fiscal year adjusted (if applicable) net income return on average equity: |
44.0% |
|
Adjusted (if applicable) latest four quarters return on market capitalization: |
2.9% |
|
GROWTH RATIOS, OUTLOOK and CALCULATED INTRINSIC VALUE PER SHARE |
|
|
5 years compounded growth in sales/share |
26.6% |
|
Volatility of sales growth per share: |
Strong steady growth |
|
5 Years compounded growth in earnings/share |
28.6% |
|
5 years compounded growth in adjusted earnings per share |
31.4% |
|
Volatility of earnings growth: |
Strong and reasonably steady growth |
|
Projected current year earnings $millions: |
$1,537.3 |
|
Management projected price to earnings ratio: |
32.8 |
|
Over the last ten years, has this been a truly excellent company exhibiting strong and steady growth in revenues per share and in (adjusted) earnings per share? |
Yes |
|
Expected growth in EPS based on adjusted fiscal Return on equity times percent of earnings retained: |
44.0% |
|
More conservative estimate of compounded growth in earnings per share over the forecast period: |
14.0% |
|
More optimistic estimate of compounded growth in earnings per share over the forecast period: |
16.0% |
|
OUTLOOK AND AMBITIONS FOR BUSINESS: For the current quarter, Q3 2023 management is projecting about a 14% increase in adjusted earnings per share. In general rate of growth can be expected to be perhaps low double digits which is significantly lower than the recent growth. The company has set ambitious growth goals for the five years with a plan to double revenue by 2026. |
|
|
LONG TERM PREDICTABILITY: lululemon has an established track record of growth including internationally and is likely to continue to grow at double digit rates. |
|
|
Estimated present value per share: We calculate $311 if adjusted earnings per share grow for 5 years at the more conservative (but still robust) rate of 14% and the shares can then be sold at a sharply reduced P/E of 20 (which may be extremely conservative) and $44 if adjusted earnings per share grow at the more optimistic rate of 16% for 5 years and the shares can then be sold at a P/E of 25. Both estimates use a 7.0% required rate of return. |
|
|
ADDITIONAL COMMENTS |
|
|
INDUSTRY ATTRACTIVENESS: (These comments reflect the industry and the company’s particular incumbent position within that industry segment.) Michael Porter of Harvard argues that an attractive industry is one where firms are somewhat protected from competition based on the following four tests. Barriers to entry (pass, as scale and established strong brand present some barriers to new competitors). No issues with powerful suppliers? (marginal pass, some suppliers have a significant share although they could probably be replaced). No issues with dependence on powerful customers (pass), No potential for substitute products (pass) No tendency to compete ruinously on price (pass). Overall this industry appears to be attractive for lululemon as an established incumbent. |
|
|
COMPETITIVE ADVANTAGE: Lululemon is positioned as a premium brand and has strong customer loyalty. It’s proprietary products give it a big advantage over most retailers. See their annual report for evidence that they really do appear to live their values. |
|
|
COMPETITIVE POSITION: lululemon would have a small but lucrative share of the total retail clothing industry. Their position in the “athleisure” segment would be larger but we are not aware of the level. |
|
|
RECENT EVENTS: The company continues to make technical innovations in its fabrics and products. Recently launched a paid membership program that includes discounts and online fitness material. The company added 81 stores in fiscal 2022 adding an impressive 14% to the store count. In 2021 the store count was increased by 10% with a heavy focus on China. During the pandemic, the company was very successful in moving sales to the online platform. In 2020 acquired MIRROR, an online fitness business, at a net cost of $453 million — $363 million of which was paid for goodwill. However almost the entire value of the acquisition was written off in fiscal 2022 as the online fitness craze cooled off considerable with people returning to gyms. |
|
|
ACCOUNTING AND DISCLOSURE ISSUES: No issues have been noted. In fact the disclosure appears to be very good. |
|
|
COMMON SHARE STRUCTURE USED: Normal, one vote per share. |
|
|
MANAGEMENT QUALITY: The company appears to be very well managed. |
|
|
Capital Allocation Skills: Appear to be strong given the history. However the acquisition of MIRROW has turned out to have been a wise use of capital. |
|
|
EXECUTIVE COMPENSATION: Compensation is generous but is not a big concern given the size and profitability of the company. Total compensation for named officers in 2022 ranged from about $4.0 million to about $15.6 million U.S. dollars. |
|
|
BOARD OF DIRECTORS: Warren Buffett has suggested that ideal Board members be owner-oriented, business-savvy, interested and financially independent. There are 11 members and they are elected in groups to serve three years. Some members including the chair have many years on the Board. This is likely a strong Board. We do note that Board compensation is quite high. |
|
|
Basis and Limitations of Analysis: The following applies to all the companies rated. Conclusions are based largely on achieved earnings, balance sheet strength, achieved earnings per share growth trend and industry attractiveness. We undertake a relatively detailed analysis of the published financial statements including growth per share trends and our general view of the industry attractiveness and the company’s growth prospects. Despite this diligence our analysis is subject to limitations including the following examples. We have not met with management or discussed the long term earnings growth prospects with management. We have not reviewed all press releases. We typically have no special expertise or knowledge of the industry. |
|
|
DISCLAIMER: All stock ratings presented are “generic” in nature and do not take into account the unique circumstances and risk tolerance and risk capacity of any individual. The information presented is not a recommendation for any individual to buy or sell any security. The authors are not registered investment advisors and the information presented is not to be considered investment advice to any individual. The reader should consult a registered investment advisor or registered dealer prior to making any investment decision. For ease of writing style the newsletter and articles are often written in the first person. But, legally speaking, all information and opinions are provided by InvestorsFriend Inc. and not by the authors as individuals. The author(s) of this report may have a position, as disclosed in each report. The authors’ positions may subsequently change without notice. |
|
|
© Copyright: InvestorsFriend Inc. 1999 – 2023. All rights to format and content are reserved. |
|