
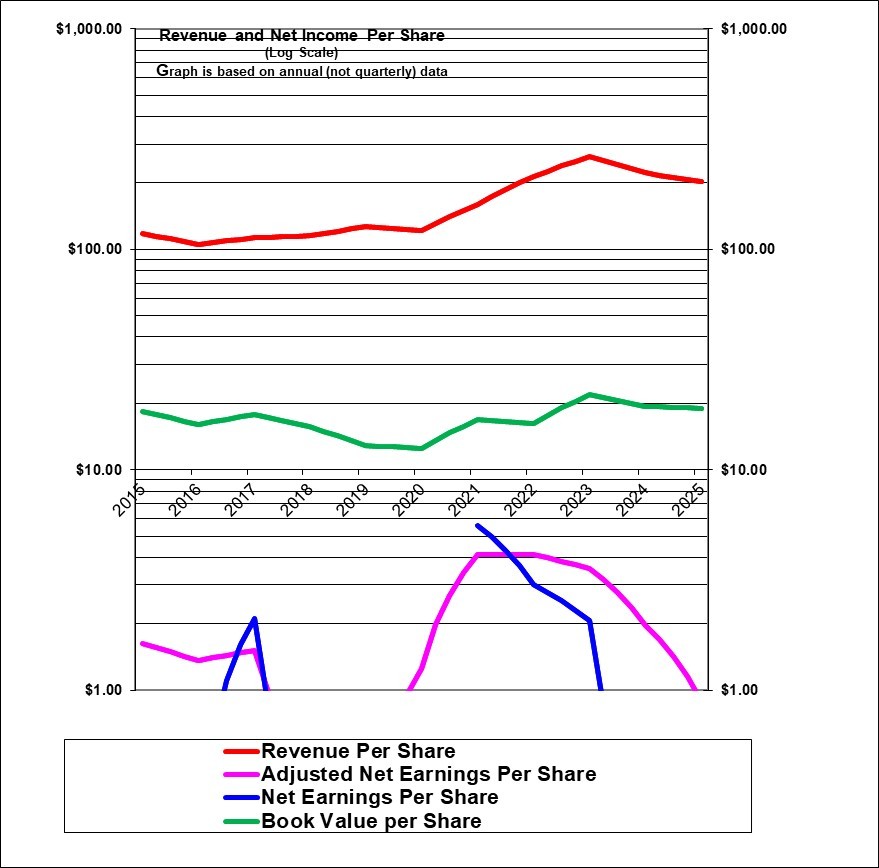
Revenue per share (the red line) was relatively flat from 2015 to 2020 before growing very strongly for three years and then declining in the past two years – and will decline noticeably going forward due to divestitures of all the problematic U.S. dealerships. Adjusted earnings per share have been very volatile caused partly by recession conditions in Alberta related to low oil prices after 2014 and due to money-losing U.S. dealerships. Profits fell after 2015 and then went into losses partly due to the recession in Alberta but also in large part due to the prior apparently incompetent management (led by Steve Landry that was in place for several years prior to being replaced in 2018. Profits initially staged an excellent recovery under the newer management but then fell sharply more recently. In 2025 management has changed again.
|
AutoCanada Inc. (ACQ, Toronto) |
|
|
RESEARCH SUMMARY |
|
|
Report Author(s): |
InvestorsFriend Inc. Analyst(s) |
|
Author(s)’ disclosure of share ownership: |
The Author(s) hold shares |
|
Based on financials from: |
Dec ’25 Y.E. |
|
Last updated: |
April 2, 2026 |
|
Share Price At Date of Last Update: |
$ 21.24 |
|
Currency: |
$ Canadian |
|
Generic Rating (This rating does not consider the circumstances of any individual investor and is therefore not specific advice for any individual): |
Speculative Weak Buy / Hold at $21.24 |
|
Qualifies as a stock that could be bought with confidence to hold for 20 years? |
No |
|
Has Wonderful Economics? |
No |
|
Has Excellent and Trustworthy Management? |
To be determined, past management was poor |
|
Likely to grow earnings per share at an attractive rate over the next decade? |
Not clear |
|
Positive near-term earnings outlook? |
Maybe |
|
Valuation? |
Fairly valued at best. |
|
SUMMARY AND RATING: The graph of revenues per share (red line) shows that revenues per share had growth in 2021 to 2023 after a period of flatness but then have declined in 2024 and 2025 and will decline more due to divestitures. Adjusted earnings per share have been volatile and recently far too low. The Value ratios don’t provide much help due to the low earnings and would support a rating of only Speculative Hold at best. The current management team has yet to prove itself. The insider trading signal is positive. There is very strong ownership by an investment firm which is a strong vote of confidence. Former executive chair, Paul Antony retains his 11% of the chares which is positive. The near-term outlook looks poor. A possible recession is a headwind. The company presumably has scale advantages over individually owned dealerships. Overall, we now rate this a Speculative Weak Buy / Hold at $21.24. Be aware of its past volatility and the risks due to the high debt level. |
|
|
MACRO ENVIRONMENT: Possible recession and higher unemployment could lower the need for new vehicle purchases. |
|
|
LONG TERM VALUE CREATION: (As of Q4 2025) AutoCanada as of now, has created at best only modest value in the long term. |
|
|
DESCRIPTION OF BUSINESS: (Updated based on Q4 2025) AutoCanada owns 64 franchised automobile dealerships in Canada with 23 different brands (in eight provinces). In addition it has 14 stand-alone collision centres (and a total of 32 collision centres) , and 3 independent used vehicle dealerships. It has 11 remaining dealerships around Chicago that are all for sale and classified as discontinued and are reported to be “under definitive purchase agreements”. Annual revenue is running at about $4.9 billion dollars and has decreased due to divestitures and will decrease further with the U.S. divestitures. In 2025 they sold approximately 71,000 new and used vehicles in Canada. |
|
|
ECONOMICS OF THE BUSINESS: This is very questionable as of early 2026 as gross margins and profits have decreased for a number of reasons. They do seem to have a history of good cash flows even when GAAP earnings are low or negative. |
|
|
RISKS: See annual report for additional risks. Recession is a near-term risk. The company does not seem concerned about its debt levels but we think it could be problematic. In the long-term the switch to electric vehicles could be a risk due to lower service needs. Also manufacturers could move to a direct selling model. As a result of a settlement / fine in the U.S. regarding used car sales practices, it seems possible that a class action lawsuit could result. |
|
|
INSIDER TRADING / INSIDER HOLDING: Based on May 2025 to April 2, 2026. Edge point equity fund bought 131,000 shares for Alberta investment management at about $20 and a further 87,000 for their own account at $20 mostly in May 2025 and are a major shareholder. An executive bought 4575 shares at $22 for about $100,000 and now holds 5345 shares. An executive bought 5,346 in May to July 2025 at about $22. A director bought 5000 shares at $18.66 in May 2025 to hold 5000 in that account. After the share price plunged with the Q3 earnings release one executive bough 1200 shares at $19.51. Subsequent to November four executive bought shares paying as high as $22. Overall the insider trading signal is positive. |
|
|
WARREN BUFFETT’s CRITERIA: Buffett indicates that all investments must pass four key tests: the business is simple to understand and predict (pass), has favorable long-term economics due to cost advantages or superior brand power (marginal pass ), apparently able and trustworthy management (remains to be seen, past management was poor), a sensible price – below its intrinsic value (marginal pass), Other criteria that have been attributed to Buffett include: a low debt ratio (fail, even without considering the floorplan debt), good recent profit history (marginal pass), little chance of permanent loss of the investors capital (probable pass) a low level of maintenance type capital spending required to maintain existing operations excluding growth (marginal pass at best as dealerships have to be refreshed periodically). |
|
|
MOST RECENT EARNINGS AND SALES TREND: The growth in revenue per share in the past six quarters beginning with the most recent (Q4, 2025) was minus 14%, minus 29%, minus 19%, minus 15%, minus 13% and minus 1%. GAAP earnings per share growth in the past four quarters starting with the most recent (Q4, 2025) has been has become quite low and volatile and subject to various unusual items and sometimes negative. The earnings trend has turned quite negative in the past two years or more with some positive and some negative quarters. |
|
|
COMPARABLE STORE SALES: Revenues in 2025 were recently down significantly partly due to divestitures but also due to weak market conditions. In Q4 2025, same-store revenue was down 9% and in Q#$ was down 12% and in Q2 was down 1%. |
|
|
Earnings Growth Scenario and Justifiable P/E: The trailing year P/E ratio has turned negative on a GAAP basis but 18.5 based on continuing operations. |
|
|
VALUE RATIOS: Analysed at a price of $21.24. The price to book ratio is 1.13 which, on its face, is potentially attractive, however note that a very large portion of the assets are intangible (appears to be goodwill and equivalent), such that the tangible book value is deeply negative, indicating that the company has already paid a large premium above hard asset value to acquire the dealerships (and they have had to write a substantial amount of that off a some years ago because – under the prior management – they paid too much for some dealerships). There is no dividend. Earnings are too low, too volatile and have too many unusual gains and losses to provide any real guidance in terms of P/E or ROE. P?E based on trailing earnings from continuing operations is neutral in attractiveness at 18.5. The P/E based on analyst forward earnings estimates is attractive at 9.5. Revenues per share have declined due to divestitures of U.S. dealerships as well as lower same-store sales. Overall, these value ratios don’t provide much guidance other than to indicate that this is a speculative investment which could be rated a Speculative Hold. |
|
|
TAXATION FOR SHARE OWNERS: Nothing unusual. |
|
|
SUPPORTING RESEARCH AND ANALYSIS |
|
|
Symbol and Exchange: |
ACQ, Toronto |
|
Currency: |
$ Canadian |
|
Contact: |
ir@autocan.ca |
|
Web-site: |
www.autocan.ca |
|
INCOME AND PRICE / EARNINGS RATIO ANALYSIS |
|
|
Latest four quarters annual sales $ millions: |
$4,896.3 |
|
Latest four quarters annual earnings $ millions: |
$30.3 |
|
P/E ratio based on latest four quarters earnings: |
17.1 |
|
Latest four quarters annual earnings, adjusted, $ millions: |
$28.0 |
|
BASIS OR SOURCE OF ADJUSTED EARNINGS: We used the adjustments provided by management involving balance sheet revaluation of liabilities, and goodwill write-offs and recent management severance costs including deducting any gains on asset sales. Recently there have been adjustments related to hedges on debt costs as well as a write off of the value of used vehicle inventory. We made no adjustments quarterly made starting in 2024 because there are too many things to adjust and no reliable figure would result. But used earnings from continuing operations for 2024 and 2025 annual earnings adjusted. |
|
|
Quality of Earnings Measurement and Persistence: Adjusted earnings measurement has not been that reliable given a persistent pattern of write-offs for several years. Recently there were large adjustments related to finance hedges. Recently there were losses on a Gap basis and the U.S. dealerships have suffered big losses. |
|
|
P/E ratio based on latest four quarters earnings, adjusted |
18.5 |
|
Latest fiscal year annual earnings: |
$16.0 |
|
P/E ratio based on latest fiscal year earnings: |
32.3 |
|
Fiscal earnings adjusted: |
$21.5 |
|
P/E ratio for fiscal earnings adjusted: |
24.1 |
|
Latest four quarters profit as percent of sales |
0.6% |
|
Dividend Yield: |
0.0% |
|
Price / Sales Ratio |
0.11 |
|
BALANCE SHEET ITEMS |
|
|
Price to (diluted) book value ratio: |
1.13 |
|
Balance Sheet: (last updated for Q2, 2025) Assets consist of 2% cash, 29% inventories (95% is vehicles and 5% is parts and accessories), 7% accounts receivable (including minor other current assets) 11% property and equipment (largely dealership land and buildings although for the majority of the dealerships they lease land and buildings, 26% goodwill and equivalent, 13% capitalized leases, 1% deferred income tax. These assets are supported on the liability and equity side of the balance sheet as follows: 32% floor plan debt (which finances the 29% of assets that are inventories), 15% capitalized lease liabilities (which more than finances the 11% in capitalized lease assets) , 18% long-term debt, 8% accounts payables, 17% common equity, 2% deferred income tax, and 1% minority interest equity. Overall, with a low common equity ratio this appears to be a somewhat weak balance sheet even assuming that the goodwill and equivalent maintains its value (and there have been write-offs) and it depends also on not treating floorplan debt as “debt” but rather offsetting it against inventories. |
|
|
Quality of Net Assets (Book Equity Value) Measurement: This business, like most, is valued for its earnings and cashflows. The book value of equity is smaller than goodwill and equivalent to goodwill (the value of franchise agreements) therefore the tangible equity is negative. |
|
|
Number of Diluted common shares in millions: |
24.6 |
|
Controlling Shareholder: As of Spring 2025), An investment firm (EdgePoint) held 33.4% of the shares and has effective control; of the company. Former executive Chairman Paul Antony owns 11.0% of shares plus substantial options is probably the main person in control of the company. In August 2020 Robert Steele, an Atlantic Canada owner of about 42 auto dealerships acquired over 10% of the company – which was a good vote of confidence from a knowledgeable investor. He soon reduced that to just under 10% possibly to avoid reporting requirements. It’s not clear if he has subsequently sold additional shares but there is some indication that he likely did reduce the investment quite possibly to under 3% or less. |
|
|
Market Equity Capitalization (Value) $ millions: |
$522.5 |
|
Percentage of assets supported by common equity: (remainder is debt or other liabilities) |
16.8% |
|
Interest-bearing debt as a percentage of common equity |
112% |
|
Current assets / current liabilities: |
0.9 |
|
Liquidity and capital structure: (Updated for Q4 2025) Excluding the debt used to finance inventory the debt is 112% as large as equity which may not be excessive. If we included floor plan debt then debt is about triple the equity value which can be considered quite dangerous – and this excludes lease liabilities, which are similar to debt. It appears that the company relies heavily on a very large line of credit as well as long-term debt notes. The company also has substantial debt-like lease payment obligations. The S&P credit rating was set at a lowly B+ in early 2022 and has been confirmed at that level as of early 2024 and the outlook on that was revised from negative to stable in September 2025. This is a weak credit rating and increases their borrowing costs. However they have ample available credit – so it seems the banks are quite willing to lend despite the low credit ratings. Overall, the liquidity and credit strength is weak and could be a concern going forward. At September 30, 2025 they had $92 million in cash and available credit of $254 million. In addition it has very substantial credit available to increase its floorplan inventory. Debt covenants were relaxed significantly in the Summer of 2024 due to circumstances but debt covenants appear to be well met as of Q3 2025. |
|
|
RETURN ON EQUITY AND ON MARKET VALUE |
|
|
Latest four quarters adjusted (if applicable) net income return on average equity: |
6.0% |
|
Latest fiscal year adjusted (if applicable) net income return on average equity: |
4.6% |
|
Adjusted (if applicable) latest four quarters return on market capitalization: |
5.4% |
|
GROWTH RATIOS, OUTLOOK and CALCULATED INTRINSIC VALUE PER SHARE |
|
|
5 years compounded growth in sales/share |
10.6% |
|
Volatility of sales growth per share: |
steady |
|
5 Years compounded growth in earnings/share |
negative past earnings |
|
5 years compounded growth in adjusted earnings per share |
-6.8% |
|
Volatility of earnings growth: |
Volatile, including losses |
|
Projected current year earnings $millions: |
not available |
|
Management projected price to earnings ratio: |
not available |
|
Over the last ten years, has this been a truly excellent company exhibiting strong and steady growth in revenues per share and in (adjusted) earnings per share? |
No |
|
|
|
|
Expected growth in EPS based on adjusted fiscal Return on equity times percent of earnings retained: |
4.6% |
|
More conservative estimate of compounded growth in earnings per share over the forecast period: |
5.0% |
|
More optimistic estimate of compounded growth in earnings per share over the forecast period: |
10.0% |
|
OUTLOOK AND AMBITIONS FOR BUSINESS: The outlook as of April 2026 is poor. They claim restructuring and revised operating procedures (staff optimisation and consolidating operations) has achieved a run rate operating expense savings of $115 as of the end of 2025. With divestitures of problematic dealerships it is possible that results will now be substantially better on a GAAP basis. Industry conditions appear poor for 2026 as consumers face inflation and relatively high interest costs. |
|
|
LONG TERM PREDICTABILITY: It’s not entirely clear if AutoCanada can survive much less thrive. Car dealerships should be reasonably predictable although there is some possibility for eventual industry disruption such as increased direct sales from manufacturers to customers as well as from the reduced service needs of electric vehicles. |
|
|
Estimated present value per share: Earnings are too low and too much affected by unusual items and too uncertain for this calculation at this time. |
|
|
ADDITIONAL COMMENTS |
|
|
INDUSTRY ATTRACTIVENESS: (These comments reflect the industry (car dealers in this case) and the company’s particular incumbent position within that industry segment. Michael Porter of Harvard argues that an attractive industry is one where firms are somewhat protected from competition based on the following four tests. Barriers to entry (pass, since the manufacturers control the number of dealers). No issues with powerful suppliers (fail, because dealers are heavily dependent on the manufactures). No issues with dependence on powerful customers (pass), No potential for substitute products (pass) No tendency to compete ruinously on price (fail because dealers appear to compete aggressively with each other on price). Overall this industry appears to be unattractive at least as far as new car sales, collision as well as parts and service are better aspects of the business. |
|
|
COMPETITIVE ADVANTAGE: AutoCanada benefits from its scale in a highly fragmented industry. |
|
|
COMPETITIVE POSITION: The Canadian auto dealer industry has traditionally been highly fragmented and has not included publicly traded entities. AutoCanada is Canada’s only publicly-traded dealer group. There are other large dealer groups that compete as well. |
|
|
RECENT EVENTS: Announced a partnership with Autotrader on March 31, 2026. Appointed an interim CEO in Fall 2025 (and then made him permanent in early 2026) as Paul Antony left the company. Closed its 5 remaining used car RightRide dealerships in March 2025 after having closed seven in 2024. Bought a collision repair shop near Edmonton on October 6, 2025, announced a partnership with car gurus for digital marketing. Sold several U.S. dealerships in 2025 and has contracts to sell the remaining 11 and exit that market. Hired Bain and company to assist with restructuring and cost cutting. Suspended share repurchases in summer 2024. Sold two Chrysler dealers ships in Alberta in Q3 2024. Closed 7 of its 16 RightRide locations in 2024 and is now discontinuing that division. In late 2023 they undertook a transaction to buy back from its own management the 19% minority interest that they owned in its used car division. This resulted in a very substantial gain and pay-day for the executives but they committed to use the after-tax proceeds to buy AutoCanada shares on the market. That RiteRide division later turned out to be worthless. In 2023 they sold a 10% interest in a new online marketing project with Kijiji for $25 million which appeared to place a high value on that business. They have an exclusive deal with Kijiji that they believe will give them access to used vehicles at better prices and well as to sell finance and insurance products to private sale buyers on Kijiji. |
|
|
ACCOUNTING AND DISCLOSURE ISSUES: The disclosure seems good and quite detailed. The company focuses on adjusted EBITDA rather than adjusted earnings which is disappointing. They give a lot of detail regarding the volume of sales and gross profit on the four categories of their earnings. It is interesting that the adjusted earnings are often lower than the actual earnings. It is rare to see a company adjust earnings lower to remove unusual gains. There have been a LOT of adjustments in recent years (with many related to finance costs due to hedging) which may make the adjusted earnings figure less reliable. They may have an aggressive view of free cash flow since they treat all dealer relocation and major improvements as growth capital spending. In 2025 they are restating past results to account for divested dealerships. We don’t like restating history. |
|
|
COMMON SHARE STRUCTURE USED: Normal, one vote per share. |
|
|
MANAGEMENT QUALITY: New management is in place as of mid 2025 and their abilities have yet to be determined. For the past seven years Paul Antony was in charge and seemed to try hard and had many initiatives. He was saddled problems from prior management. In the end, it’s not clear that he accomplished much other than survival of the company. Paul Antony took over in 2018 from former CEO Steve Landry who did an absolutely terrible job including buying what became money-losing U.S. dealerships near Chicago which was a disastrous purchase. |
|
|
Capital Allocation Skills: It’s now clear that AutoCanada’ s former management under Steve Landry had shown exceptionally poor capital allocation skills in the past. The large write-off of the then relatively recent U.S. acquisition (substantially more than half of the $132 million paid!) suggests the acquisition decision was extremely poor indeed and perhaps represents negligence on the part of the former management. Paul Antony taking over in 2018 initially approached capital allocation on a survival basis selling off some assets and doing many sale and lease back transactions. These were probably necessary for survival. Later he resumed the growth-by-acquisition strategy. However, we would question Paul Antony’s decision to buy back substantial shares in late 2022 at about $28.and then $27 and we would also question their aggressive use of debt and continued dealer purchases in 2023 and earlier in 2024 given the higher interest rates. |
|
|
EXECUTIVE COMPENSATION: In 2025 the compensation of the five named officers ranged from $1.2 million to $5.5 million Which was for a departing officer and mostly associated with his PSUs (Performance Share Units and settled at 200% whatever that means. This compensation looks excessive in such a poor year. |
|
|
BOARD OF DIRECTORS: Warren Buffett has suggested that ideal Board members be owner-oriented, business-savvy, interested and financially independent. There was considerable turn-over in the Board a few years ago. There are now six members, only one of which dates from the disastrous days of Steve Landry CEO. It appears that the current Board is of reasonably high quality. Many initiatives have been tried in recent years and several have not worked out (Right-Ride used car division closed, U.S. dealerships FINALLY being sold, an auction business sold, an IT and marketing arrangement with a New Brunswick firm now no longer mentioned, an arrangement t with Kijiji apparently gone). |
|
|
Basis and Limitations of Analysis: The following applies to all the companies rated. Conclusions are based largely on achieved earnings, balance sheet strength, achieved earnings per share growth trend and industry attractiveness. We undertake a relatively detailed analysis of the published financial statements including growth per share trends and our general view of the industry attractiveness and the company’s growth prospects. Despite this diligence our analysis is subject to limitations including the following examples. We have not met with management or discussed the long term earnings growth prospects with management. We have not reviewed all press releases. We typically have no special expertise or knowledge of the industry. |
|
|
DISCLAIMER: All stock ratings presented are “generic” in nature and do not take into account the unique circumstances and risk tolerance and risk capacity of any individual. The information presented is not a recommendation for any individual to buy or sell any security. The authors are not registered investment advisors and the information presented is not to be considered investment advice to any individual. The reader should consult a registered investment advisor or registered dealer prior to making any investment decision. For ease of writing style the newsletter and articles are often written in the first person. But, legally speaking, all information and opinions are provided by InvestorsFriend Inc. and not by the authors as individuals. The author(s) of this report may have a position, as disclosed in each report. The authors’ positions may subsequently change without notice. |
|
|
© Copyright: InvestorsFriend Inc. 1999 – 2026. All rights to format and content are reserved. |
|