Aecon Group Inc.
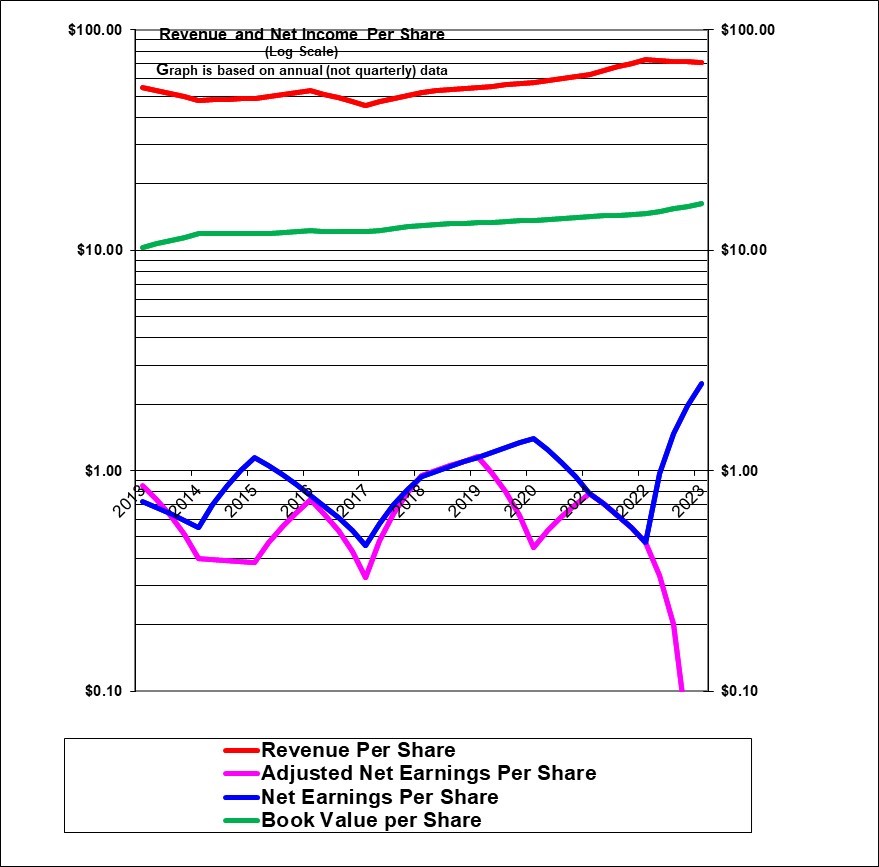
Revenues per share had been growing at an average of 10% for the five calendar years ending 2022 but decline d3% in 2023 due to the sale of a business unit and the sale of 50% of another business unit. Book value per share has increased at a compounded average annual rate of 4.7% over the past ten years – which is not terrible given the dividend. GAAP as well as adjusted earnings have been quite volatile over the past ten years. We deducted the net benefit of the government wage subsidy in adjusted earnings in 2020. Aecon itself described the wage subsidy as a “net benefit” apparently over and above the costs of the pandemic. In adjusted earnings, we also deducted the gains on asset sales in the latest results. Substantial gains were deducted in 2023.
Note that the earnings line is extremely far below the revenue line. This reflects the very thin (low) net profit margins of this company.
|
Aecon Group Inc. (ARE, Toronto) |
|
|
RESEARCH SUMMARY |
|
|
Report Author(s): |
InvestorsFriend Inc. Analyst(s) |
|
Author(s)’ disclosure of share ownership: |
Author(s) hold shares |
|
Based on financials from: |
December ’23 Y.E. |
|
Last updated: |
March 9, 2024 |
|
Share Price At Date of Last Update: |
$ 17.03 |
|
Currency: |
$ Canadian |
|
Generic Rating (This rating does not consider the circumstances of any individual investor and is therefore not specific advice for any individual): |
Sell at $17.03 |
|
Qualifies as a stock that could be bought with confidence to hold for 20 years? |
No |
|
Has Wonderful Economics? |
No |
|
Has Excellent and Trustworthy Management? |
Good builders, but very poor financial management |
|
Likely to grow earnings per share at an attractive rate over the next decade? |
Yes from a very low level |
|
Positive near-term earnings outlook? |
Yes |
|
Valuation? |
Not attractive |
|
SUMMARY AND RATING: The graph of revenues per share (red line) shows good growth in recent years, but then a modest decline in 2023, after a flatter period earlier. The adjusted earnings per share have been quite volatile and too low. Adjusted earnings would be far higher if we added back losses on “legacy” projects but those have been recurring . The Value ratios appear to indicate a rating of Sell. Management quality appears strong operationally in terms of getting things built but with very weak cost and/or bidding financial management. Beginning in Q2 2022 management appears to really shirk responsibility for four money-losing contracts by calling them “legacy” contracts. The insider trading signal is negative. The CEOs compensation seems high in relation to the weak results. The CFO’s compensation also appears to be too high. The outlook is for revenue growth and for earnings to be materially higher and perhaps at an acceptable level as they have already (IN THEORY!) pre-booked all expected future losses on the four problematic contracts and three of those contracts are near completion and there could be some recoveries given disputes on the four projects. The economics of the business seem very poor given the relatively low ROEs of recent years and the risks although they claim this will improve sharply. It likely has some competitive advantages in terms of know how and established operations but nevertheless pricing in the industry appears to be very competitive which has limited profitability. Overall we would rate this as a Sell on the basis that management forecasts a sharp improvement but poor past results definitely call for skepticism on that point. The recent sharp recovery in the share price provides an exist opportunity but also suggests that the market does see much better results ahead. A reasonable strategy would be to sell at least half. |
|
|
MACRO ENVIRONMENT: Governments are investing in infrastructure which is positive for Aecon. However inflation and sharply higher interest rates are material headwinds. |
|
|
LONG TERM VALUE CREATION: The long term value creation appears to be weak. |
|
|
DESCRIPTION OF BUSINESS: Aecon Group Inc. is a large Canadian construction company that builds, repairs and upgrades large infrastructure and industrial projects and in some cases finances and operates infrastructure. Infrastructure projects includes roads and bridges, pipelines, transit rail, hydro electric projects, tunnels, airports and much more. Industrial projects include SAGD oil sands, LNG plants, plant maintenance turnarounds, Nuclear reactor repairs and upgrades electricity transmission and distribution lines, water and sewer construction and much more. The finance and operate segment called “Concessions” includes notably a large contract to upgrade (that’s done) the Bermuda International Airport and to operate it for 30 years ending 2046. It also includes “P3” projects, several LRT systems and the Gordie Howe International Bridge. In many cases including in Concessions, Aecon participates as a joint venture partner and often manages the joint ventures. Concession operations involve recurring revenues. In most cases the construction involves fixed price or maximum price bidding. In 2022, revenue was 96% from Canada 2% from International (mostly Bermuda) and 2% from the U.S. The company made a large investment in intangible assets in Bermuda in order to secure the 30 year Concession on the Airport. It appears they have recouped all of that with the sale of half of that concession that is soon to close. The great majority of revenues (98%!) are from the construction segment. The breakdown of net profit between the two divisions was not clear. |
|
|
ECONOMICS OF THE BUSINESS: (Based on Q4 2023 trailing year figures) With a recent adjusted net profit that amounted to a modest loss, he economics look extremely weak although that was largely due to losses on “legacy” projects that they hope are now largely behind them. Overall the economics appear to be very weak. But the company claims that it is much more profitable outside of four “legacy” problematic contracts. |
|
|
RISKS: Cost overruns and execution problems on projects are probably the biggest risks. This includes the risk of litigation regarding project execution. The annual report has an unusually clear description of the various risks. This is definitely a risky business. |
|
|
INSIDER TRADING / INSIDER HOLDING: Checking insider trading from March 1, 2023 to March 10, 2024: The CEO sold 81,000 shares on March 20 , 2023at $13.16. Three Sectors bought modest amounts at around $9.80 in late 2023 but this appeared to be Board compensation related. Four insiders sold shares at prices around $12 to $13. In additional there was same buying “under a plan” . Overall, this is a negative insider trading signal. As far as insider ownership, incredibly John Beck who founded the company in 1963 and was CEO for over 50 years until 2018 and is still on the board apparently holds no common shares at all (Except a slim 10,000 very recently purchased) and a relatively modest $5.9 million in deferred share units. Board member, J.D. Hole owns a large amount of common shares at 600,000 (apparently down from a recent 650,000) . Director Eric Rosenfeld owns 267,000 shares. Director Tony Franceschini (former long-time Stantec CEO) holds 90,000 common shares. The current CEO holds just 5,500 common shares and has a total ownership of $8.1 million largely in deferred and restricted share units earned as compensation. This is a low level of common shares owned by insiders. |
|
|
WARREN BUFFETT’s CRITERIA: Buffett indicates that all investments must pass four key tests: the business is simple to understand and predict (fail due to its industrial nature, volatile history and risks), has favorable long-term economics due to cost advantages or superior brand power (fail based on low achieved past earnings most years), apparently able and trustworthy management (fail given past results), a sensible price – below its intrinsic value (unable to determine), Other criteria that have been attributed to Buffett include: a low debt ratio (pass), good recent profit history (fail) little chance of permanent loss of the investors capital (marginal pass) a low level of maintenance type capital spending required to maintain existing operations excluding growth (pass for existing operations excluding expansion) |
|
|
MOST RECENT EARNINGS AND SALES TREND: The recent earnings trend is very poor. Earnings were severely impacted in 2022 and again in 2023 by four large problematic projects that incurred losses. Revenues per share in the past four quarters beginning with Q4 2023 and going back were down 11.5% (mostly due to sales of certain divisions), down 8%, up 2%, and up 9%. Adjusted earnings in 2023 were negative were down sharply in 2022 but this may not be a fair comparison due to a wage subsidy the prior year and other one-time factors. Earnings per share in 2021 were down 44% but that was partly due to the high wage subsidies in 2020. Adjusting for CEWS 2021 earnings were up some 75% although still too low. Adjusted earnings per share in 2020 were up 19% on a GAAP basis and down 69% if we deduct the net benefit of the wage subsidy. Adjusted earnings per share in 2019 rose 22% and revenue per share was up 5%. The latest trend is poor. The long term trend has been volatile and relatively flat. |
|
|
COMPARABLE STORE SALES OR INDUSTRY SPECIFIC STATISTICS |
|
|
Earnings Growth Scenario and Justifiable P/E: This is not a company with predictable steady earnings growth and so the P/E may be relatively meaningless. The trailing P/E is negative but the forward P/E is 21.3. |
|
|
VALUE RATIOS: Analysed at $17.03. The price to book value ratio is ostensibly attractive at 1.05 but this reflects the generally low ROE and the risky nature of the business and is more of a condemnation than anything to cheer. The dividend yield is reasonably attractive at 4.5% – but it appears unsustainable unless earnings improve sharply which is a danger sign. In the trailing year we adjusted to remove significant gains on asset sales in the latest quarter. The trailing 12 month adjusted ROE is negative and was higher but not good pre-pandemic in 2019 at 8.8% and the average ROE over the past 10 years has been weak. If we adjusted away the losses on the “legacy” projects then the P/E would be reasonably attractive . Revenues per share have compounded up at an average of only 2.6% over the past ten years. The historic earnings per share growth has been quite poor but earnings per share did rise quite sharply in 2018 and rose again in 2019 but declined in 2020 after deducting the net benefit of the government wage subsidy and was moderately below the 2019 level in 2021 and 2022. Overall, the value ratios would support a rating of Sell. The only attractive ratio is the dividend. The earnings are too volatile to be of much guidance. |
|
|
TAXATION FOR SHARE OWNERS: Nothing unusual. |
|
|
SUPPORTING RESEARCH AND ANALYSIS |
|
|
Symbol and Exchange: |
Aecon Group Inc. |
|
Currency: |
$ Canadian |
|
Contact: |
aborgatti@aecon.com |
|
Web-site: |
www.aecon.com |
|
INCOME AND PRICE / EARNINGS RATIO ANALYSIS |
|
|
Latest four quarters annual sales $ millions: |
$4,643.9 |
|
Latest four quarters annual earnings $ millions: |
$161.9 |
|
P/E ratio based on latest four quarters earnings: |
6.9 |
|
Latest four quarters annual earnings, adjusted, $ millions: |
$(4.7) |
|
BASIS OR SOURCE OF ADJUSTED EARNINGS: Adjusted for gains on sale (including the sale of a division in 2015 and sale of a division plus real estate in Q2 2023) and unrealized foreign exchange gain or loss. No FX adjustment in 2020 or 2021. Also adjusted for an unusual $7 million severance type payment in 2019. We adjusted for a large Canada Emergency Wage benefit in 2020 because the company treated this as a net benefit but not for the smaller amount in 2021 which appeared to be more of a wash against the pandemic costs. |
|
|
Quality of Earnings Measurement and Persistence: Lower quality due to volatility and risks. |
|
|
P/E ratio based on latest four quarters earnings, adjusted |
negative |
|
Latest fiscal year annual earnings: |
$161.9 |
|
P/E ratio based on latest fiscal year earnings: |
7.0 |
|
Fiscal earnings adjusted: |
$(4.8) |
|
P/E ratio for fiscal earnings adjusted: |
negative |
|
Latest four quarters profit as percent of sales |
-0.1% |
|
Dividend Yield: |
4.5% |
|
Price / Sales Ratio |
0.24 |
|
BALANCE SHEET ITEMS |
|
|
Price to (diluted) book value ratio: |
1.05 |
|
Balance Sheet: The following describes the consolidated balance sheet (Q4 2023). Assets are comprised as follows: 20% cash (although 60% of this is in joint ventures and not at the parent level), a hefty 35% is accounts receivable plus other receivables and pre-paid expenses and inventories , 22.5% is unbilled revenue (construction in progress, some of which may be in dispute) Just 8% is property and equipment (land, buildings, machinery and equipment and vehicles), 7% is projects and invested accounted for as equity investments including their 50% of the 23 year Bermuda Airport contract, 3% is purchased goodwill, 3% is deferred income tax assets and the remaining 1.5% is software and long-term financial assets. Overall, this company has an unusually high level of investments in working capital (current assets) at a total of 77% of its assets. These assets are funded on the other side of the balance sheet as follows: 32% by accounts payable, 16% by deferred (pre-collected) revenue (these two together could be said to finance most but not all of the accounts receivable and unbilled revenue) 13% by debt (counting the preferred share investment as debt to be conservative), 33% by common equity and 4% by deferred income taxes and 2% by other / rounding. Overall this appears to be a reasonably strong balance sheet. The balance sheet has been improved by recent asset sales. The company may have excess cash. |
|
|
Quality of Net Assets (Book Equity Value) Measurement: It appears that the book value per share is reliable and the assets are of real value. |
|
|
Number of Diluted common shares in millions: |
65.5 |
|
Controlling Shareholder: There is no controlling shareholder. |
|
|
Market Equity Capitalization (Value) $ millions: |
$1,116.2 |
|
Percentage of assets supported by common equity: (remainder is debt or other liabilities) |
33.3% |
|
Interest-bearing debt as a percentage of common equity |
39% |
|
Current assets / current liabilities: |
1.4 |
|
Liquidity and capital structure: The balance sheet appears to be reasonably strong. It now appears to have ample cash after selling one division and half of its Bermuda Airport Concession. It appears that its credit rating is in the lower end of investment grade or may be somewhat below investment grade. |
|
|
RETURN ON EQUITY AND ON MARKET VALUE |
|
|
Latest four quarters adjusted (if applicable) net income return on average equity: |
-0.5% |
|
Latest fiscal year adjusted (if applicable) net income return on average equity: |
-0.5% |
|
Adjusted (if applicable) latest four quarters return on market capitalization: |
-0.4% |
|
GROWTH RATIOS, OUTLOOK and CALCULATED INTRINSIC VALUE PER SHARE |
|
|
5 years compounded growth in sales/share |
6.3% |
|
Volatility of sales growth per share: |
Stable |
|
5 Years compounded growth in earnings/share |
21.3% |
|
5 years compounded growth in adjusted earnings per share |
-160.0% |
|
Volatility of earnings growth: |
Volatile |
|
Projected current year earnings $millions: |
not available |
|
Management projected price to earnings ratio: |
not available |
|
Over the last ten years, has this been a truly excellent company exhibiting strong and steady growth in revenues per share and in (adjusted) earnings per share? |
No |
|
Expected growth in EPS based on adjusted fiscal Return on equity times percent of earnings retained: |
-5.6% |
|
More conservative estimate of compounded growth in earnings per share over the forecast period: |
2.0% |
|
More optimistic estimate of compounded growth in earnings per share over the forecast period: |
10.0% |
|
OUTLOOK AND AMBITIONS FOR BUSINESS: As of Q4 2023. The near-term outlook is for revenue growth in the next two years in the high single digits. Management expects government infrastructure projects to ramp up. Also, the Bermuda Airport will likely do significantly better in the next year. In theory, adjusted profits should be sharply higher in 2024 because they have already booked all the expected future losses on the four problematic contracts and three of those contracts are near completion. But they have a very poor history of estimating these losses. Inflation impacts on its many remaining fixed price contracts may be a major headwind in the quarters ahead. Aecon’s main ambition is to be “the number one Canadian infrastructure company”. It is currently third behind PCL Construction and EllisDon. It is possible tthat it will settle certain contract disputes witch could result in a major one-time boost to profit although that does not appear to be imminent and may never materialise. |
|
|
LONG TERM PREDICTABILITY: Aecon can be predicted to remain in business and to grow. But its earnings per share have been volatile and have not trended up in the past ten years. Given its historic relatively weak ROE levels, it is not clear that Aecon can move to a higher ROE and sustain it. The company however recognises that margins have been too low and is moving away form risky fixed price contracts to some extent. |
|
|
Estimated present value per share: Current profit levels are too low to allow for this calculation. |
|
|
ADDITIONAL COMMENTS |
|
|
INDUSTRY ATTRACTIVENESS: (These comments reflect the industry and the company’s particular incumbent position within that industry segment.) Michael Porter of Harvard argues that an attractive industry is one where firms are somewhat protected from competition based on the following four tests. Barriers to entry (pass, barriers include scale and knowledge and financing). No issues with powerful suppliers (marginal pass at best, as unionized workers constitute a powerful supplier who can usurp much of the profits). No issues with dependence on powerful customers (marginal pass at best since various governments and large companies constitute key customers), No potential for substitute products (pass) No tendency to compete ruinously on price (fail given competitive bid nature of the work). Overall this industry appears to be relatively unattractive even for a large established competitor. |
|
|
COMPETITIVE ADVANTAGE: Aecon has deep industry knowledge and capabilities. |
|
|
COMPETITIVE POSITION: We do not have information on this. They have a goal to be “clearly the number one Canadian infrastructure company”. As of 2021 they were third largest after PCL and EllisDon. |
|
|
RECENT EVENTS: There a modest dividend increase at the start of 2024. Its Ontario highway construction division has been divested in 2023 for a price of $235 million. This division represented 7% of revenue and had 1000 employees. There was a modest $38 million pre-tax gain on the sale. They also sold just under half of their Bermuda Airport concession in Q3 2023. The gain was $139 million pre-tax. The company notes that it has won several major new contracts. In 2023 they effectively sold a portion of their utility-focused subsidiary receiving cash and with buyer owning a large convertible preferred share with a high dividend. As of early 2024, Aecon remains in a major contract dispute regarding its work on the Coastal GasLink Pipeline resulting from delays and cost increases caused by COVID and other reasons that they claim are the clients responsibility. The client is withholding payment while demanding that the work proceed. And the client has counter-sued. A dispute arose in 2020 regarding the Kemano Generating Station Second tunnel Project where the contract was terminated. An older major dispute with K&S Potash remains unresolved. As of Q2 2022 they revealed that they have a total of four major contract disputes and describe these as “legacy” contracts. Subsequently HUGE losses were booked on these contracts but are getting close to the end of three of these. On the Q2 2023 conference call the company seemed to indicate that it might receive compensation from clients related to various disputes. |
|
|
ACCOUNTING AND DISCLOSURE ISSUES: There are complexities in the accounting due to numerous joint venture projects some of which are accounted for via the equity method and some where they consolidate their proportionate share. It appears that cash taxes were significantly higher than the accounting income taxes in 2022, 2021 and 2020 and there was really no explanation of this – but it could actually be a sign that “true” profits are higher than the GAAP reported profits. There is no break-down of net profit between the Construction and Concessions segment. The reports seem to focus on EBITDA and gross profit with very little mention of net earnings or ROE. Overall, there is a lot that could be improved in the disclosure. In Q4 2022 there was a good deal of confusion regarding whether they have accrued for future estimated losses on four legacy projects and if so, how much. Later it was confirmed that they had accrued against future losses but the accrual was vastly too small as losses increased. In 2023 more complexity was added as they accepted a large investment in a subsidiary in return for a very high interest convertible preferred share. |
|
|
COMMON SHARE STRUCTURE USED: Normal, one vote per share. |
|
|
MANAGEMENT QUALITY: The current CEO Jean-Louis Servranckx was appointed on September 4th 2018. He hails from France and previously was CEO of a large civil works / infrastructure company that operated in Europe, Africa and Canada. The previous long-time CEO had been CEO for over 50 years except for a 29 month period ending in November 2016 when he became Executive chair. Overall, given the low ROE history of Aecon it appears that management is strong operationally (as constructors) but generally very poor at bid pricing, cost control and generating reasonable profits. |
|
|
Capital Allocation Skills: At the present time, the company’s capital allocation skills cannot be described as very good or excellent. Its return on capital has not been attractive. |
|
|
EXECUTIVE COMPENSATION: For 2022: The executives were compensated from $1.4 million to $6.1 million. The compensation seems too high in relation to the weak performance. THE CEO and CFRO in particular appear to be over-paid. |
|
|
BOARD OF DIRECTORS: Warren Buffett has suggested that ideal Board members be owner-oriented, business-savvy, interested and financially independent. Aecon has nine Board members. Several members have extensive construction industry experience. This includes a long-time former Stantec CEO. One member is a lawyer and was involved in securities regulation. Two board members are from the investment industry. Most of the directors have little or nothing invested beyond what they earned for compensation. Overall, it appears to be a fairly strong Board. |
|
|
Basis and Limitations of Analysis: The following applies to all the companies rated. Conclusions are based largely on achieved earnings, balance sheet strength, achieved earnings per share growth trend and industry attractiveness. We undertake a relatively detailed analysis of the published financial statements including growth per share trends and our general view of the industry attractiveness and the company’s growth prospects. Despite this diligence our analysis is subject to limitations including the following examples. We have not met with management or discussed the long term earnings growth prospects with management. We have not reviewed all press releases. We typically have no special expertise or knowledge of the industry. |
|
|
DISCLAIMER: All stock ratings presented are “generic” in nature and do not take into account the unique circumstances and risk tolerance and risk capacity of any individual. The information presented is not a recommendation for any individual to buy or sell any security. The authors are not registered investment advisors and the information presented is not to be considered investment advice to any individual. The reader should consult a registered investment advisor or registered dealer prior to making any investment decision. For ease of writing style the newsletter and articles are often written in the first person. But, legally speaking, all information and opinions are provided by InvestorsFriend Inc. and not by the authors as individuals. The author(s) of this report may have a position, as disclosed in each report. The authors’ positions may subsequently change without notice. |
|
|
© Copyright: InvestorsFriend Inc. 1999 – 2024. All rights to format and content are reserved. |
|