Starbucks Corporation
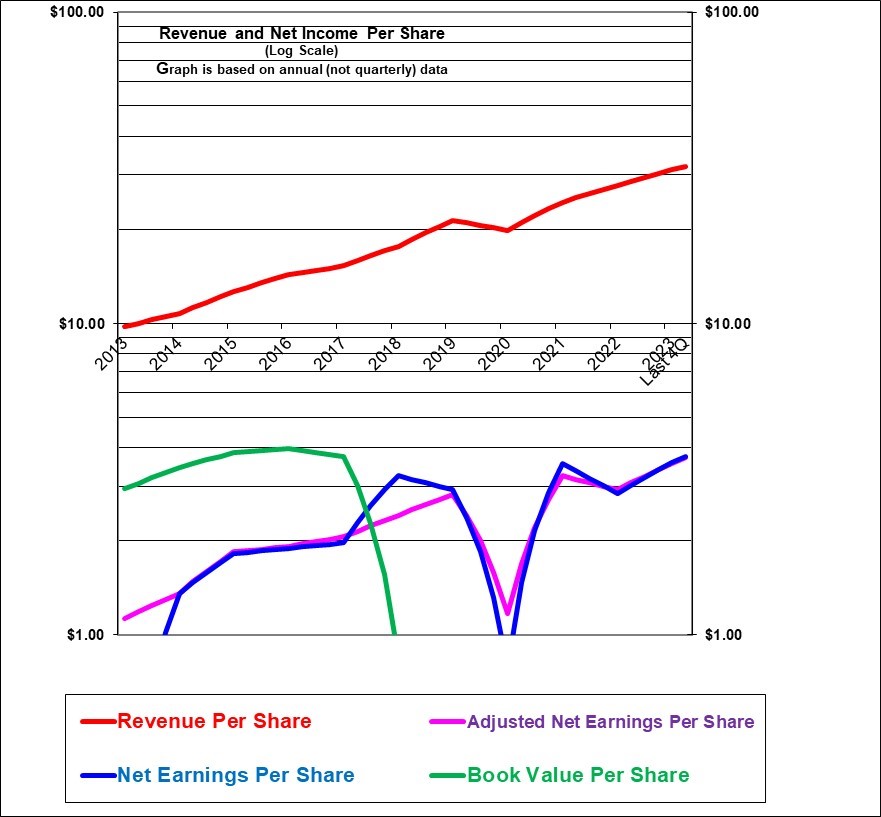
The Starbucks chart was of course impacted by COVID-19 in 2020 but then staged a strong recovery in revenues per share although earnings per share have not returned to the level the former growth trend would have suggested.
Book value per share is negative but this is not a concern since it was simply due to the large share buy-back program. And it shows the strength of Starbucks’ cash flows in that it is able to easily use debt financing despite having paid out all of its share capital in buy backs as well as dividends.
| Starbucks (SBUX, U.S.) | |
| RESEARCH SUMMARY | |
| Report Author(s): | InvestorsFriend Inc. Analyst(s) |
| Author(s)’ disclosure of share ownership: | The Author(s) hold no shares |
| Based on financials from: | Sept. ’23 Y.E. + Q1 ’24 |
| Last updated: | February 6, 2024 |
| Share Price At Date of Last Update: | $ 95.41 |
| Currency: | $ United States |
| Generic Rating (This rating does not consider the circumstances of any individual investor and is therefore not specific advice for any individual): | Buy rated at $95.41 |
| Qualifies as a stock that could be bought with confidence to hold for 20 years? | Yes |
| Has Wonderful Economics? | Yes, definitely |
| Has Excellent and Trustworthy Management? | Yes |
| Likely to grow earnings per share at an attractive rate over the next decade? | Yes |
| Positive near-term earnings outlook? | Yes |
| Valuation? | Somewhat Expensive |
| SUMMARY AND RATING: The graph of revenue per share and earnings per share growth demonstrates Starbucks’ history of growth in revenues and earnings per share until the unusual decline in earnings with the pandemic in 2020 followed by a very strong recovery. The book value per share is now negative but this is not a concern as it occurred deliberately because of aggressive share buy backs (the share count is down 24% in the past ten years) and actually illustrates the financial strength of this company. Management quality is strong. The Value ratios, in isolation, would support a rating of (lower) Buy or Buy. The insider trading signal is neutral. The company itself has accelerated its share buy back program in the latest quarter. The company has very strong competitive advantages in terms of its world-class brand value. It is a high quality company with a high return on assets and a high degree of predictability of future growth. The company appears to pass the Buffett tests in terms of simplicity, profitability, good management and a reasonable (although not bargain) price. The near term outlook appears to be good based on strong same-store sales gains although it does face union pressures. It is the type of high quality company that could be held indefinitely. Our rating at this time is Buy based on the quality of the company and despite a somewhat high valuation. | |
| MACRO ENVIROMENT: Although there are predictions of recession, the macro environment does not appear to be threatening to Starbucks at this time. Starbucks is benefiting from the return to travel and to a slower extent the return to office trends. | |
| LONG TERM VALUE CREATION: Starbucks clearly has an extremely strong record of value creation. | |
| DESCRIPTION OF BUSINESS: (Updated for Q2 fiscal ’23 figures ) As of April 2, 2023 there were 36,634 Starbucks stores. About half (51%) are company-operated and half are ran by licensed operators. About half (46%) of the stores are in the USA and Canada. They have a large presence in China and Japan, all or nearly all company-operated. They rarely do one-off franchise style licenses, instead licensees operate many stores. Starbucks leases its store locations and does not own the land or buildings, however, it does own a number of locations related to distribution, roasting, and warehousing. In company-owned stores 74% of the revenue is from coffee and other beverages, 22% from food and 4% from other including packaged tea and coffee, mugs and coffee-making equipment. The company directly employs about 400,000 people. | |
| ECONOMICS OF THE BUSINESS: The economics of the business are clearly very good. After-tax profits in fiscal 2023 were 11.6% of revenue. | |
| RISKS: For a complete discussion of risks, please see the annual report. In our view important risks are risks due to any product health scares. Economic down-turn is a short-term risk. Political tensions between the USA and China are a possible risk. Customer data security and breaches are a risk. Employee dissatisfaction and unionization drives are current risks. | |
| INSIDER TRADING / INSIDER HOLDING: (updated February 5, 2024) There has not been much insider trading activity in the past year. Four insiders sold shares mostly at just over $100 (range $94 to $108). This included the CFO. The founder Howard Shultz had bought shares in May 2022 at $68 and $73. Overall, the insider trading signal is about neutral given few sales and given the price is now lower at $92.50. | |
| WARREN BUFFETT’s CRITERIA: Buffett indicates that all investments must pass four key tests: the business is simple to understand (pass), has favourable long-term economics due to scale and superior brand power (pass), apparently able and trustworthy management (pass), a sensible price – below its intrinsic value (marginal pass), Other criteria that have been attributed to Buffett include: a low debt ratio (pass – low debt to market value although, high debt in relation to assets and a negative book value), good recent profit history (pass based on latest quarter but some declines before that) little chance of permanent loss of the investors capital (pass) a low level of maintenance type capital spending required to maintain existing operations excluding growth (marginal pass as capital spending is currently planned to upgrade stores) | |
| MOST RECENT EARNINGS AND SALES TREND: Revenues per share in the past four quarters starting with the most recent (Q1 fiscal 2024which ended December 31, 2023 2) were up 10%, up 19%! up 13% and up 14%. Adjusted earnings per share in the same four quarters were up 20%, up 31%, up 19% and up 25%. In the fiscal year ended October 1, 2023, revenues per share were up 12% and adjusted earnings per share were up 21%. In the fiscal year ended October 2, 2022 revenues per share were up 14% but adjusted earnings per share were down 10%. Overall, Starbucks has a very strong recent trend of revenue per share growth and earnings per share growth. | |
| INDUSTRY SPECIFIC STATISTICS: Comparable store sales growth in the past four quarters beginning with the most recent (Q1 fiscal 2024 ended December 31, 2023) was 5% (3% transaction volume and 2% ticket growth)8% (4% ticket size and 3% traffic growth), , 10% (5% volume and 4% ticket) and 11% (6% traffic growth and 4% ticket growth). Store count growth was 5.1% in fiscal 2023 driven mostly by international. The operating margin increased substantially in fiscal 2023 from 14.3% to 16.3%. As of Q1 fiscal 2024 there were 34.3 million active Starbucks loyalty members in the U.S. up 13% year-over-year. | |
| Earnings Growth Scenario and Justifiable P/E: The current trailing P/E of 25 and forward P/E of 23 is pricing in earnings per share growth in the low double digits. | |
| VALUE RATIOS: Analyzed at $95.41. There is no meaningful price to book ratio since the book value is negative (see recent events) because the company has had sufficient cash flows to pay out all of its invested capital. Similarly the ROE is no longer meaningful for the same reason. The return on assets is very strong at 14.6%. The trailing year P/E ratio is somewhat unattractively high at 26 but may be justified by the growth and quality. The dividend yield is modest at 2.4% but the dividend has been increasing it represents a payout ratio of 61%. We calculate the intrinsic value as $82 to $114. Overall the value ratios would suggest a rating of (lower) Buy. | |
| TAXATION: Nothing unusual for a U.S. stock. Canadian investors are subject to the 15% dividend withholding tax except in RRSP / RIF accounts. It’s also of course not eligible for the Canadian dividend tax credit. | |
| SUPPORTING RESEARCH AND ANALYSIS | |
| Symbol and Exchange: | SBUX, U.S. |
| Currency: | $ United States |
| Contact: | investorrelations@starbucks.com |
| Web-site: | www.starbucks.com |
| INCOME AND PRICE / EARNINGS RATIO ANALYSIS | |
| Latest four quarters annual sales $ millions: | $36,687.0 |
| Latest four quarters annual earnings $ millions: | $4,293.7 |
| P/E ratio based on latest four quarters earnings: | 25.5 |
| Latest four quarters annual earnings, adjusted, $ millions: | $4,247.4 |
| BASIS OR SOURCE OF ADJUSTED EARNINGS: We used managements’ reported GAAP to non-GAAP adjustments from the quarterly filings. | |
| Quality of Earnings Measurement and Persistence: Earnings had grown relatively steadily until a sharp dip due to COVID-19 followed by a strong recovery . Revenues are based on company-operated stores, licensed stores, and consumer packaged goods and foodservice. Costs are primarily operating, G&A, depreciation and amortization. As a result, earnings are based primarily on cash and likely a quality estimate. | |
| P/E ratio based on latest four quarters earnings, adjusted | 25.8 |
| Latest fiscal year annual earnings: | $4,124.5 |
| P/E ratio based on latest fiscal year earnings: | 26.6 |
| Fiscal earnings adjusted: | $4,074.5 |
| P/E ratio for fiscal earnings adjusted: | 26.9 |
| Latest four quarters profit as percent of sales | 11.6% |
| Dividend Yield: | 2.4% |
| Price / Sales Ratio | 2.99 |
| BALANCE SHEET ITEMS | |
| Price to (diluted) book value ratio: | -12.63 |
| Balance Sheet: (as of Q2 2022) The shares are clearly valued for the earnings and so the balance sheet is not very important at all. Nevertheless it is interesting to take a look at it. The assets are comprised as follows: 28% is capitalized leases (most of their space is leased) 22% is property, plant and equipment (largely leasehold improvements, store equipment and furniture – virtually all retail locations are leased and not owned), 13% is goodwill and similar purchased intangibles, 12% is accounts receivables, inventories and prepaid expenses, 14% is cash plus a small amount of short-term investments – but note that $4.0 billion in cash amounts to less than $4 per share, 6% is deferred tax assets, 2% is investments and 2% is other long term assets. These assets are supported as follows: negative 30% by common equity as more than all the retained earnings and invested equity has now been paid out mostly in share buy-backs but also in dividends, 55% by debt, 31% by operating lease liability, 14% by accounts payable and accrued liabilities, 28% by deferred pre-paid revenue some of which represents customer pre-paid cards and much of which represents a license payment for Nestle and which could be considered to be essentially equity), and 2% by other long-term liability. While debt looks high, on a market-value basis the great majority of the assets are in its goodwill value and the debt is not excessive at 18% as large as the market value of the equity and 4.1 times trailing earnings. | |
| Quality of Net Assets and Book Value Measurement: This company is clearly valued for earnings and not for its book value of assets. | |
| Number of Diluted common shares in millions: | 1,140.6 |
| Controlling Shareholder: There is no controlling shareholder. The founder and former long-time CEO and now returning CEO, Howard Shultz owns just 1.9% of the company which is down from 3.5% in 2019. This information was not disclosed in the more recent proxy statements as he was then not a director. The company is largely owned by institutional investors. | |
| Market Equity Capitalization (Value) $ millions: | $108,824.6 |
| Percentage of assets supported by common equity: (remainder is debt or other liabilities) | -29.5% |
| Interest-bearing debt as a percentage of common equity | -170% |
| Current assets / current liabilities: | 0.7 |
| Liquidity and capital structure: (updated Feb. 5, 2024) The liquidity appears good. Over the years Starbucks has grown without requiring additional share issues. Over the past ten years, it has reduced its share count by about 25% through a large buy-back program. The balance sheet debt level appears high given negative book equity (strictly due to massive share buy backs) but the debt as a percentage of the market value of equity is only 14%. Overall, the liquidity and balance sheet strength are strong. | |
| RETURN ON EQUITY AND ON MARKET VALUE | |
| Latest four quarters adjusted (if applicable) net income return on average equity: | negative equity |
| Latest fiscal year adjusted (if applicable) net income return on average equity: | negative equity |
| Adjusted (if applicable) latest four quarters return on market capitalization: | 3.9% |
| GROWTH RATIOS, OUTLOOK and CALCULATED INTRINSIC VALUE PER SHARE | |
| 5 years compounded growth in sales/share | 12.0% |
| Volatility of sales growth per share: | Steady growth |
| 5 Years compounded growth in earnings/share | 2.0% |
| 5 years compounded growth in adjusted earnings per share | 7.9% |
| Volatility of earnings growth: | Mostly moderate volatility |
| Projected current year earnings $millions: | not available |
| Management projected price to earnings ratio: | not available |
| Over the last ten years, has this been a truly excellent company exhibiting strong and steady growth in revenues per share and in (adjusted) earnings per share? | Yes |
| Expected growth in EPS based on adjusted fiscal Return on equity times percent of earnings retained: | #VALUE! |
| More conservative estimate of compounded growth in earnings per share over the forecast period: | 6.0% |
| More optimistic estimate of compounded growth in earnings per share over the forecast period: | 9.0% |
| OUTLOOK AND AMBITIONS FOR BUSINESS: Earnings per share and revenues are likely to continue to increase about 10% in the next year. But union challenges could be a headwind. | |
| LONG TERM PREDICTABILITY: Given the company’s plans to continue to open new locations and add a line of high-end cafes, it would be reasonable to assume that Starbucks will continue to grow over the next ten years. As Starbucks becomes more established in areas where new stores are being opened, there may be economies of scale to be had in terms of warehousing and distribution. | |
| Estimated present value per share: We calculate $82 if adjusted earnings per share grow for 5 years at the more conservative rate of 6% and the shares can then be sold at a sharply reduced P/E of 20 and $113 if adjusted earnings per share grow at the more optimistic rate of 9% for 5 years and the shares can then be sold at a relatively unchanged P/E of 25. These estimates use a 7.0% required rate of return. | |
| ADDITIONAL COMMENTS | |
| INDUSTRY ATTRACTIVENESS : (These comments reflect the industry and the company’s particular incumbent position within that industry segment.) Michael Porter of Harvard argues that an attractive industry is one where firms are somewhat protected from competition based on the following four tests. There are barriers to entry in terms of scale and brand name (pass). There appears to be no issues with powerful suppliers including labour, which is primarily non-unionized (pass). There are no issues with dependence on powerful customers (pass), and there is some potential for substitute drinks however, the coffee consumption habit is deep enough to ignore that possibility (pass). There is no demonstrated tendency to compete ruinously on price (pass). Overall this industry appears to be attractive for a well-established incumbent. | |
| COMPETITIVE ADVANTAGE: Starbucks has established one of best known brand names in the world. Starbucks has established operating practices that allow it to rapidly open new locations while maintaining consistency and quality. Starbucks continues to open a significant number of new locations in the China and Asia Pacific markets, as well as the Americas (although it also culled a significant number of locations in the U.S. and particularly in Canada). | |
| COMPETITIVE POSITION: Starbucks clearly has a very strong competitive position in the coffee-on-the go market. It has a weaker competitive position in Canada due to the success of Tim Hortons and also McDonalds in this country. | |
| RECENT EVENTS: Founder Howard Schultz stepped down from the Board in September 2023. This was planned ahead of time and may have been done to give the new CEO free reign. The store count increased by 5% in fiscal 2023 driven mostly by the international segment. In January 2023 (Q1) sold their Seattle’s Best brand to Nestlé for $110 million with a $91 million pre-tax gains. In march 2023 the new CEO Laxman Narasimhan took the helm. He was most recently CEO of a British multinational consumer health hygiene and nutrition company. Prior to that he was an executive with PepsiCo and prior to that spent 19 years at McKinsey & Company consultants. They recently launched the Oleato beverage brand which is a cold flavored beverage. In April 2022, Founder Howard Schultz had returned as temporary CEO after the retirement of the Kevin Johnson who had been CEO for five years. The company has embarked on renewal strategies involving store and technology improvements as well as higher pay and more staff training. | |
| ACCOUNTING AND DISCLOSURE ISSUES: The disclosure appears to be good and open and stated in an easy to understand manner without excessive unnecessary detail. In 2018, Starbucks received a $7 billion dollar up-front licencing fee from Nestle which will be amortised into revenue at $175 million per year over 40 years. In some ways this is sort of fake non-cash revenue and earnings for future years since they already have the cash. But it will be consistent each year. It is currently boosting earnings by about 4%. Offsetting this they are amortising about $223 million per year of intangibles mostly related to acquired rights that is a non-cash expense and, more importantly, the rights acquired are not likely actually declining in value. This lowers earnings and the two items here largely offset each other. | |
| COMMON SHARE STRUCTURE USED: Normal, 1 vote per share | |
| MANAGEMENT QUALITY: The management is judged to be high quality as the company has achieved high returns on equity and continues to grow. The new CEO who took over in March 2023 is outsider Laxman Narasimhan who was recently CEO of a British consumer health, hygiene and nutrition company and before that an executive with PepsiCo and before that served 19 years at Mckinsey& company consultants. | |
| Capital Allocation Skills: Starbucks has displayed strong capital allocation skills by sticking to its proven formula. The share buy backs in recent years have been aggressive and have increased the debt leverage considerably but it was a good strategy and probably remains a good strategy despite higher interest rates. Buy backs were paused in 2020 but resumed in 2021 but were suspended by Howard Schultz as of April 2022. (This suspension does not seem wise given the lower share price). Buybacks resumed in late 2022 and accelerated by the end of 2023. | |
| EXECUTIVE COMPENSATION: Total compensation for founder Howard Shultz who returned as temporary CEO was a fairly nominal $375,000 in 2022. The other six named executives were in the $4 million to $17 million range. Overall, given the size of the company, this level of executive compensation while generous is not a concern. | |
| BOARD OF DIRECTORS: The board of directors is composed of 8 members who all appear to be well qualified. (Several years ago there were 11) The Board members have a wide range of business experience including having occupied positions at large retail, well-branded, international companies. | |
| Basis and Limitations of Analysis: The following applies to all the companies rated. Conclusions are based largely on achieved earnings, balance sheet strength, achieved earnings per share growth trend and industry attractiveness. We undertake a relatively detailed analysis of the published financial statements including growth per share trends and our general view of the industry attractiveness and the company’s growth prospects. Despite this diligence our analysis is subject to limitations including the following examples. We have not met with management or discussed the long term earnings growth prospects with management. We have not reviewed all press releases. We typically have no special expertise or knowledge of the industry. | |
| DISCLAIMER: All stock ratings presented are “generic” in nature and do not take into account the unique circumstances and risk tolerance and risk capacity of any individual. The information presented is not a recommendation for any individual to buy or sell any security. The authors are not registered investment advisors and the information presented is not to be considered investment advice to any individual. The reader should consult a registered investment advisor or registered dealer prior to making any investment decision. For ease of writing style the newsletter and articles are often written in the first person. But, legally speaking, all information and opinions are provided by InvestorsFriend Inc. and not by the authors as individuals. The author(s) of this report may have a position, as disclosed in each report. The authors’ positions may subsequently change without notice. | |
| © Copyright: InvestorsFriend Inc. 1999 – 2024. All rights to format and content are reserved. | |