Are Long Term Bonds a Good Investment Now?
This article concludes that long-term bonds are probably a poor investment choice at this time and should be avoided – except perhaps as a way to speculate on lower interest rates. It also compares the recent and historic performance of long-term bonds (specifically 20-year U.S. treasury bonds) to that of the S&P 500 index.
For both stocks and bonds, recent performance is not necessarily any indication of future performance. Stocks of course are well known to be volatile. A long term government bond, even though it will mature at precisely its issue price can be surprisingly volatile over its life.
Consider a 20-year U.S. treasury bond issued at $1000 with a 2.0% yield. If interest rates drop to 1.0% after one year, the bond is then worth $1172 for a capital gain of 17% and that’s in addition to the 2% interest received. But it is a certainty that over its remaining 19 year life the capital gain will reverse and the bond will mature at $1000. And if interest rates instead rise to 3.0% in the year after the purchase then the bond would be worth only $857 for a capital loss of 14%. With this kind of volatility in a fixed income investment that will mature with no capital gain or loss, it can be difficult to interpret the performance of long-term bonds.
Looking at past performance, long-term (20-year) bonds purchased from about 1980 to the year 2000, which of course subsequently matured at par turned out to be very good to good investments strictly because their interest rate yields turned out to be attractive in relation to subsequent inflation. Investments in an index fund that continuously sells and buys bonds to maintain a 20-year maturity did even better because it was capturing capital gains most years as interest rates continued to decline.
Long-term (20-year) bonds purchased from 2012 to 2020, and which are not yet near maturity, have provided very good returns in spite of their very low yields. Capital gains have greatly boosted their returns. But it is important to understand that those capital gains will reverse by the time those bonds mature.
The analysis here is based on U.S. data for stocks (S&P 500 index) and bonds (20-year U.S. government treasury bonds) from 1926 through 2020. The data source is a well-known reference book called “Stocks, Bonds, Bills and Inflation” 2020 edition – which provides data through 2019. The book is published annually by Duff and Phelps. Other data sources were used for 2020.
Zero-coupon or Strip Bonds
It is important to understand that the return on a long-term zero-coupon government bond that will be held to maturity is precisely known at the purchase date.
To analyze historic bond returns or expected future bond returns it is best to start with the simplest type of bond which is a bond that only pays off at maturity. These are called zero-coupon bonds because there are no annual interest payments. Bond interest is sometimes referred to as coupon payments since bonds used to have detachable physical interest coupons attached. Zero-coupon bonds are also known as “strip bonds” because they can be created by “stripping” the interest payments or notional “coupons” from regular bonds. Zero-coupon twenty-year bonds, for example, represent a lump sum to be received in 20 years. The lack of annual interest payments simplifies the analysis. Long-term zero-coupon bonds are purchased at a large discount to their face value and the interest is effectively received all at once when the bond eventually matures at its much higher face value.
In the past few decades, long-term zero-coupon bonds have provided excellent returns. A zero-coupon twenty-year U.S. government bond purchased in 1982 and held to maturity in 2002 ultimately returned precisely its initial yield which was about 14%. A zero-coupon twenty-year U.S. government bond purchased in December 2000 and held to maturity in December 2020 returned precisely its initial yield which was about 5.6%.
Regular bonds, in contrast, pay annual annual or semi-annual interest. A regular bond issued in 1982 and paying 14% annually ended up returning something less than 14% over its life since the annual interest payments (of $140 per $1000 bond) would have been reinvested each year at prevailing interest rates that turned out to be below 14%.
A new zero-coupon twenty-year U.S. government bond purchased today and held to its maturity in February 2041 will return precisely its initial yield which is currently about 1.8%. A regular 20-year bond paying annual interest will also return something very close to its initial 1.8% yield over its life. This is because the 1.8% annual interest payments are so small ($18 per year on a $1000 bond) that it won’t matter much what interest rate those annual interest payments are reinvested at.
It seems obvious that 1.8% is not a good long-term return. And there are also very good reasons to think that stocks, as an alternative to long-term bonds, will return quite a bit more than 1.8% annually over the next twenty years. More about that below.
Historic returns of long-term bonds versus stocks
The following graph shows the compounded annual returns from one-time lump-sums invested in a 20-year bond index fund. Such a fund holds 20-year U.S. government bonds and sells those bonds probably after about one year to buy new 20-year bonds each year, to maintain a constant approximate 20-year bond maturity. The return is compared to investing the same lump sum in the S&P 500 index. The annual compounded returns for purchasing at each historic date and holding until the end of 2020 are shown. So the holding periods graphed are from 95 years (very long-term!) to just one year.
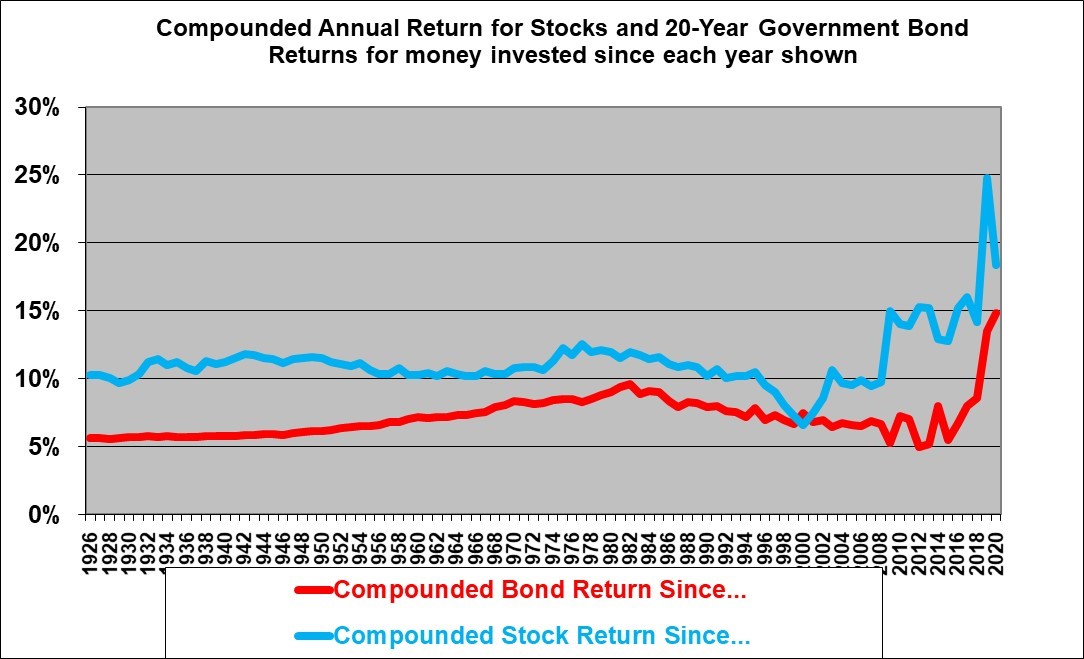
To interpret this graph, let’s start with the right-hand end at 2020 and then move left. The blue line shows that a lump-sum investment in stocks made at the start of 2020 returned about 17% as of the end of 2020, while the red line shows that a lump-sum investment in 20-year U.S. government bonds made at the start of 2020 returned about 15% as at the end of 2020. The attractive one-year return on the 20-year bond was unexpected and happened because interest rates fell from 2.19% to 1.46%.
Moving further left, the blue line shows that a lump-sum investment in stocks made at the start of 2010 returned an unusually high 14% compounded annually as of the end of 2020, while the red line shows that a lump-sum investment in 20-year U.S. government bonds made at the start of 2010 (and rolled over into new 20-year bonds annually, to maintain a constant 20-year maturity) returned a compounded amount of about 7% annually as at the end of 2020.
The results from investing a one-time lump around the year 2000 are interesting. As of the end of 2020, the stock index has returned only about 7% compounded annually which is about the same as the bond index. This happened because stocks turned out to be at a major peak around the year 2000. And because 20-year treasury bonds were yielding about 7% at that time.
Overall, the S&P 500 turned out to be the better choice in almost all the years shown. But keep in mind that the out-performance of stocks is driven by both the strong earnings of the S&P 500 companies and, importantly, by the current high valuation and P/E (price/earnings) ratio of the S&P 500 index .
Historic results for all 20 calendar year holding periods
The above graph assumed all the investing periods ended on December 31, 2020. Perhaps a better way to compare the returns from 20-year bonds to the returns from the S&P 500 is to look at all 20-year rolling returns from each.
The following graph shows the rolling 20-year returns from the S&P 500 and from a 20-year bond index fund for all 20 (calendar) year periods ending 1945 through 2020. (So a series of 20-year periods beginning at the start of each year from 1926 through 2001.) Note that a 20-year bond index fund would sell the bonds annually (for a capital gain or loss) and reinvest in new 20 year bonds in order to maintain a constant approximate 20 year maturity. The graph also includes what the 20-year bond interest rate was at the start of those periods. We also already know the interest rate at the start of the 20 year periods that will end in 2021 through 2040. And we graph that because the returns from the bond index are likely to track that beginning interest rate fairly closely.
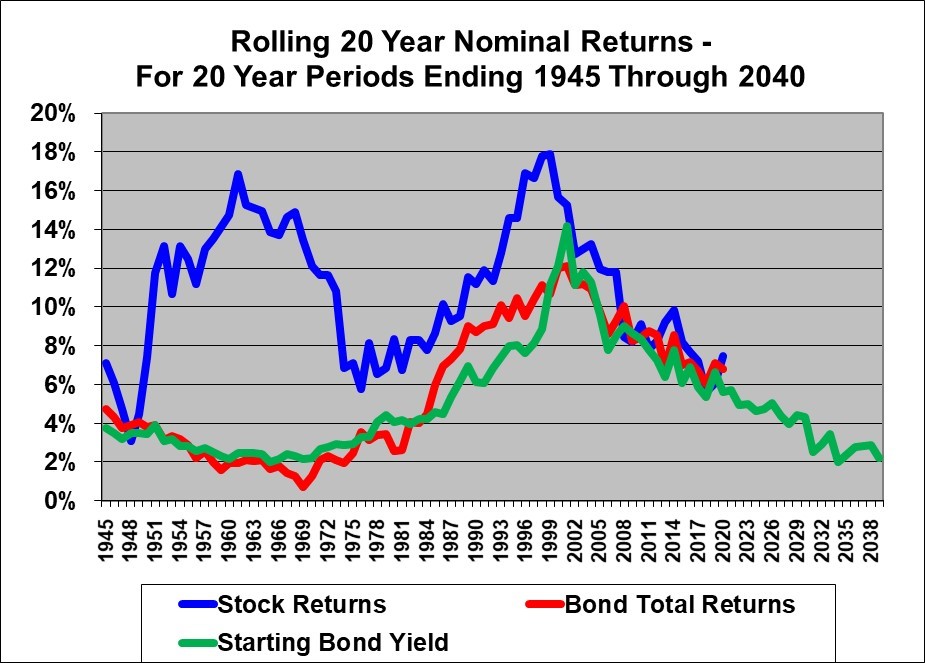
To interpret this graph, we can start from the left side. An investment in a 20-year U.S. government bond index at the start of 1926 and held until the of 1945 provided a compounded return of 4.7% over the 20 years. An investment in the S&P 500 made in 1926 and held for the same 20 years provided a compounded annual return of 7.1%. A somewhat unusual outcome was that an investment in stocks at the start of 1929 and held for 20 years ended up providing an annual compounded return of about 3.1% which was slightly lower than the return from 20-year bond index.
Investments in the S&P 500 index at the start of the years from 1932 to about 1954 and held for 20 years ending 1951 to 1973 ended up providing returns that were far superior to investing in a 20-year U.S. government bond index. Prospective long -term bond investors should be aware of the low bond returns for all the 20 year periods stated in the 1940’s and ended in the 1960’s.
For 20 year periods ended 1955 to about the year 2000, stocks also provided a higher return over the 20 years than did the bond index though by a smaller margin.
In the 20 year periods that ended in 2001 through 2020, investing in a 20-year U.S. bond index fund would have provided a return that was very similar to and occasionally higher than the return from stocks over the same 20 years.
It seems quite likely that when the returns from holding stocks for 20 years starting at the beginning of all the years from 2002 through to 2021 (and ending 2021 through 2040) are ultimately known, we will see that the blue stock line will almost always be above the red bond line. Based on how stocks have already done in the past 20 years, it seems clear that the blue line in the graph above is headed higher for periods ended 2021 through 2040 (unless stocks really crater). And the return from the 20-year bond index fund is going to track down because the starting bond yields were so much lower.
Why did 20-year long-term government bonds provide unexpectedly good returns for most investment periods starting since about 1982?
Long-term government bonds can provide good returns for two possible reasons. But one of the reasons is only temporary.
The first and most important reason why a long term bond may provide a good return is that the initial interest rate paid by the bond turns out to be an attractive rate over the life of the bond.
20-year U.S. bonds issued in 1982 at 14% provided an excellent return (of precisely 14% annually for zero-coupon bonds and about 11% for regular bonds due to the reinvestment of annual interest payments at lower interest rates) if held through to their maturity in 2002 solely because that 14% was, in retrospect, a good return. Had we had hyper-inflation (as some feared at the time) then 14% might have been a poor return. But the 1982 (zero-coupon) bond provided a 14% return simply because that was what it paid. And we now know, in retrospect, that this was a good return over the 20 years from 1982 to 2002.
The second but temporary reason that bonds can provide a good return also came (temporarily) into play for the 1982 bond.
In 1983 the market interest rate on 20-year government bonds dropped to about 11% (from 14% in 1982). This provided a significant (23%!) but temporary boost in the market value of the 1982 bond. The 1982 bond would have traded at a premium over much of its life as long-term interest rates declined significantly over the years. But in 2002 the bond matured at exactly its par value. The capital gain on the value of the 1982 bond was temporary and eventually the bond value declined to precisely its initial par value.
Over its full life the 14% return on the 14% 1982 zero coupon government bond was entirely driven by its contractual 14% interest rate. The decline in interest rates initially boosted its value but that was only a temporary impact. The fact that interest rates on 20-year bonds in 2002 had declined to 5.9% had no impact at all on the ultimate return at maturity in 2002 provided by the 1982 bond.
The situation for a 20-year bond index fund that continually sells bonds annually and buys new 20 year bonds to maintain a constant maturity of approximately 20 years is somewhat different. The capital gain in a falling rate environment would persist until some time after rates reversed and moved higher.
Bond Temporary Capital Appreciation
The temporary nature of market value gains on long-term government bonds is illustrated in the next graph which shows an index of the capital appreciation value of a 20-year government bonds index fund since 1926.
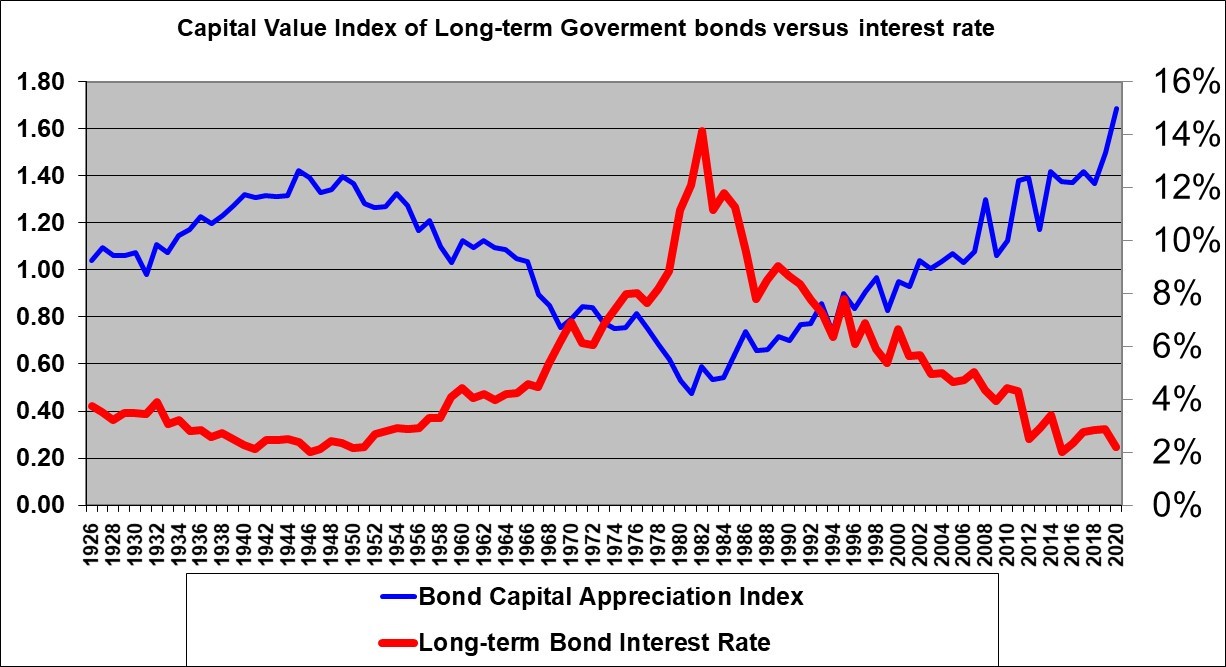
The blue line, plotted on the left scale, shows the capital appreciation on an index of 20-year U.S. government bonds starting at 1.00 at the start of 1926. The index had risen slightly above 1.0 by the end of 1926, the first point on the graph. The index then rose significantly to 1.40 in the mid 1940’s. This meant that an investment permanently maintained in 20 year government bonds through annual rollovers to new 20 year bonds and originally made in 1926 had appreciated in capital value by 40%. This excludes the value of the annual interest payments. This 40% is significant but keep in mind that it was built up over 20 years and therefore amounted to an average compounded amount of 1.7% per year.
This 40% capital value increase was driven by long-term interest rates (shown on the red line plotted on the right scale) dropping from 4% at the start of 1926 down to 2.0% in the mid 1940’s. But this capital appreciation value gain eventually evaporated as the index returned to 1.0 when interest rates returned to 4% around 1959. And the bond capital value index slumped to about 0.50 in 1982 as long-term interest rates rose to 14%. This meant that the capital portion (which totally excludes the interest payments) of an investment in long-term government bonds made in 1926 (or at anytime the capital value line was at 1.0) was worth only about 50% of the initial invested amount! The index then rose steadily all the way back to (not coincidently) about 1.40 as interest rates recently declined all the way back close to about the the 2% level of 1926 and the mid 1940’s. And the index has now gone above 1.40 as interest rates fell below 2.0%.
The red line, plotted on the right scale also shows the return that would have been made by those investing in and holding to maturity a 20-year zero coupon bond in each year from 1926 to 2020. An investor in 1932 would have made 4%. And investor in the 1940’s would have made barely over 2%, An investor at the peak in the early 80’s would have made 14% and today’s (February 8, 2021) investor in a 20-year zero coupon U.S. government bond held to maturity will, of a certainty, make a compounded annual return of about 1.8% to maturity in 2040. Regular bonds are not zero coupon and therefore investors in regular bonds would have experienced somewhat different returns by reinvesting the annual interest payments. And investors in a 20-year bond index fund make a return generally quite similar to the starting interest rate as illustrated in other graphs further above.
Consider the long-term bond issued at the start of 2020 and its misleading return to date.
An investment in a 20-year government bond at the start of 2020 returned a very attractive 14.2%. This consisted of 2.2% from the interest and a 12.0% capital gain. The capital gain was due to a substantial decline in the market interest rate on these bonds from 2.19% to 1.46% during 2020.
Ultimately however, a 2020 (zero-coupon) government bond is going to return precisely its initial yield of 2.2% compounded per year over its 20 year life. The capital gain due to an interest rate decline in 2020 provides only a temporary gain that will be reversed. The 12% gain is largely irrelevant to an investor that holds the 2020 bond to maturity in 2040. It is only relevant to bond traders that have sold or will sell the bond prior to the capital gain reversing. Bond investors who have enjoyed capital gains should be aware that the gains will be reversed if and when interest rates rise or simply by maturity for an individual bond.
What Return can we now expect from 20-year bonds?
A 20-year U.S. zero-coupon government bond purchased today should be expected, over its full life, to return its current yield of about 1.8% per year. If 20-year interest rates soon decline then the bond will provide a temporary gain in market value. If interest rates increase it will suffer a temporary loss in market value. But over its life this bond will return only and precisely 1.8%.
The fact that, as shown in the first graph above, an investment in 20-year bonds made, and permanently maintained in 20 year bonds, at any time in the past five decades has to date returned a reasonable or even a very good attractive compounded return is completely irrelevant to an estimate of returns going forward. Some of that return, will prove to have been temporary as bonds now valued at well above par eventually mature at only par value. Far from recurring in future, this temporary return boost will reverse in future years. Ultimately, the high returns on bonds from many years ago was due to their high interest rate coupons and that simply does not apply today. Recent high returns on bonds has been driven by declining interest rates that provide a temporary capital gain that is almost sure not to continue and is likely to reverse. Today’s investors should look at the low returns that resulted from investing in bonds for 20 years starting in the 1940’s when interest rates were similar to today’s low levels.
It would be a huge mistake to assume that a twenty-year 1.8% bond issued today will ultimately earn (over its full life) anything close to the high returns that bonds have provided in the past. If you base your bond return expectation on the high average bond returns made (to date) by investing at any time in the past 40 years, you will implicitly be making a seemingly logical but actually completely flawed assumption.
Technically, the return from a 2021 20-year regular government bond will be a little bit different than precisely the 1.8% initial yield if interest rates change. If interest rates rise there will be an opportunity to reinvest the annual interest payments at a higher rate. Or, if interest rates decline the reinvestment will be at lower rates which would lower the 1.5% return. However with the annual interest coupons on a $1000 bond being a meager $18 per year, the impact of reinvested interest will be extremely minor.
Should we invest in long-term government bonds?
The data appears to suggest that the answer is no. Not unless you are satisfied with an expected return on the order of 1.8% for 20-year government bonds. And long-term higher rated corporate bonds also will return no more than about 2.8% if held to maturity, since that is their approximate current yield. However, if you wish to speculate and bet that interest rates will fall then in that case a 20-year bond could be used to make that speculative bet. In that case you would be planning or hoping to sell the bond for a capital gain in the relatively short term.
Why should we expect Stocks to Return more than bonds?
The wrong way to predict stock returns would be to look at the return since year 2000 of (a highly volatile) average of about 7.5% per year or to look at the long term historical return of about 10% per year.
Mathematically the return from stocks will equal the dividend yield plus the rate of growth in earnings. (This assumes the P/E ratio will remain constant.) The dividend yield on the S&P 500 is currently about 1.5%. If earnings per share grow at about the rate of GDP, say 2% real plus 2% for inflation, this would suggest that stocks will return about 5.5% in the long term. Although this is low, it easily beats the current known return on a 20-year U.S. government bonds of 1.8% and the known 2.8% or so return from 20-year high-grade corporate bonds. But note that the return on stocks could certainly negative in the short term and the longer term return will be reduced if the P/E level declines.
Implications for Investors, Including Pension Funds
Twenty-year U.S. government bonds purchased or held as of early 2021 are destined to return only about 1.8% over their lives. A 20-year bond index fund should not be expected to do much better and could do worse. Stocks, meanwhile are providing dividend yields of 1.5% on average and the dividends and earnings can reasonably be expected to grow at 4% or more for a total return of 5.5% or more over the long term. (But they can certainly post huge losses also from time to time).
I believe that history will show that pension funds and other investors that make large allocations to (or even continue to hold large allocations of) long-term bonds in early 2021 are making a serious mistake. They would be better off to hold cash and short term investments rather than long-term bonds.
Pension funds and other large institutional investors are blindly following their historic asset allocation percentages and are arguably ignoring common sense.
Conclusion
Money invested in a well diversified portfolio of stocks in early 2021 is almost (but never quite) certain to exceed the return from investing in long-term government bonds in early 2021 which will, of a certainty, be in the range of 1.8% if held for the next 20 years.
In the short term, bonds may do better than stocks. But stocks will almost definitely do better than bonds over the next twenty years.
Warning
The suggestion to avoid long-term bonds at this time violates the traditional advice to always maintain some exposure to long-term bonds in your asset allocation. My belief is that following a traditional asset allocation approach, and investing in long-term bonds, at a time when interest rates are near the lowest levels in history defies common sense. History will be the judge.
Note that this article says nothing about holding cash or short-term bonds, it only compares long-term government bonds with stocks.
END
Shawn Allen, President
InvestorsFriend Inc.
February 8, 2021
The original version of this article was written in 2012 when 20-year U.S. bond interest rates were 2.4%. As of today following the advice of that article to avoid long-term bonds would have worked out okay – bonds actually did far better than expected but stocks did even better.
Post Script:
We can turn to Warren Buffett for some support for our arguments above.
In his 1984 letter, Warren Buffett wrote about the irrationality of investors buying long-term bonds at times of very low interest rates.
“Our approach to bond investment – treating it as an unusual sort of “business” with special advantages and disadvantages – may strike you as a bit quirky. However, we believe that many staggering errors by investors could have been avoided if they had viewed bond investment with a businessman’s perspective. For example, in 1946, 20-year AAA tax-exempt bonds traded at slightly below a 1% yield. In effect, the buyer of those bonds at that time bought a “business” that earned about 1% on “book value” (and that, moreover, could never earn a dime more than 1% on book), and paid 100 cents on the dollar for that abominable business.”
“If an investor had been business-minded enough to think in those terms – and that was the precise reality of the bargain struck – he would have laughed at the proposition and walked away. For, at the same time, businesses with excellent future prospects could have been bought at, or close to, book value while earning 10%, 12%, or 15% after tax on book. Probably no business in America changed hands in 1946 at book value that the buyer believed lacked the ability to earn more than 1% on book. But investors with bond-buying habits eagerly made economic commitments throughout the year on just that basis. Similar, although less extreme, conditions prevailed for the next two decades as bond investors happily signed up for twenty or thirty years on terms outrageously inadequate by business standards.”
Final Word
Buffett described buying tax-exempt bonds at yields around 1% in 1946 as in effect the purchase of an abominable business. And he said the bond investors accepted terms that were outrageously inadequate by business standards for the two decades after 1946. I don’t know what tax exempt bonds paid during that period but 20-year government bonds yielded 2.4% to 2.0% during 1946. Today, the 20 year U.S. treasury yield at 1.8%, is below the level where Buffett considered an investment in long-term bonds to be similar to the purchase of an abominable business offering terms that are outrageously inadequate by business standards. And today, the S&P 500 trades at a forward earnings yield of about 3.9% (the inverse of its P/E ratio of 24.4), which is vastly higher than the bond cash yield. It is true that the stock earnings yield is not available in cash (although about 1.5% of it is as dividends). The remaining 2.4% earnings yield is retained by the companies for reinvestment, often at double digit ROEs, for the future benefit of the share owners.
It would be a mistake to invest in long-term bonds today on the basis that they have provided returns similar to stocks for quite a few years now. We know, of a certainty, that 20-year government bonds purchased today, and held to maturity, will provide meager returns around 1.8%. And we can rationally expect stock returns, based on the S&P 500 index (with 1.5% dividends and another 2.4% retained for reinvestment, at relatively high ROEs) to be higher, over the next 20 years, than these inadequate bond returns.