On this page we provide links with full details of each year’s performance since the inception of this site.
2023 was a strong year in the markets. The S&P 500 index was up 24%. The Toronto stock Exchange index was up 8% in 2023 and the 31 stocks that we had rated (lower) Buy or higher were up an average of 16%.
Click For Full Details By Year: 2000 2001 2002 2003 2004 2005 2006 2007 2008 2009 2010 2011 2012 2013 2014 2015 2016 2017 2018 2019 2020 2021 2022 2023
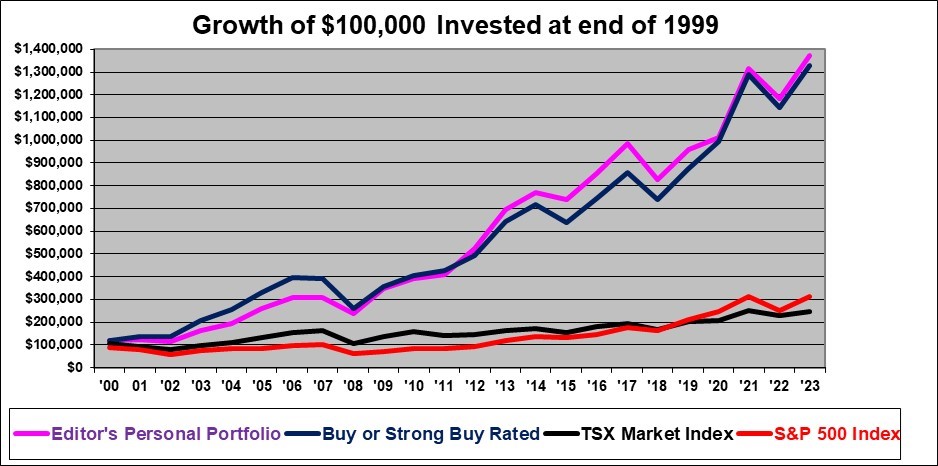
The graph below is of a type often called a “mountain chart”. You can see why – it shows how a mountain of wealth can be created over a period of years. As of December 31, 2023, our Buy or Strong-Buy rated stocks are up 1230% and the Editor’s personal total return has been 1273% since the end of 1999. Meanwhile the Canadian TSX index is up just 148% in the 24 years since the end of 1999 and the S&P 500 index is up by just 213% since the end of 1999. In fairness, it looking at these graphs it should be noted that while it shows the end result fairly, it distorts the year by year results which are better shown on a log scale.
Past performance is no guarantee of future performance nor is it necessarily in any way indicative of future performance.
Since the beginning of 2000, an equal investment in each of our Buy-rated stock picks as of the start of each year would have turned $100,000 into $1,330,331 dollars with no further investments. And this occurred despite three market crashes in that time (2000, 2008 and a brief one in 2020). This performance has walloped the market.
Dividends were not readily available to be included and are therefore excluded in the above chart, as they almost always are when stock indexes are discussed. (Except that the Editor’s portfolio in the chart includes dividends, since that is how brokers report actual portfolios). Costs of trading are of course excluded in the table except again for the editor’s portfolio for which the performance is after all trading costs. The editor’s portfolio is also after the impact of changes in the U.S. dollar exchange rate while the other line items do not include this.
We rate stocks all through the year, but for performance tracking purposes we track the stocks that we had rated at the start of each year, as further explained below. Complete details of each stock in each rating category are provided in links to each year below.
We don’t exaggerate our performance in any way such as by telling you only about the gains of only our best Stock Picks (as do many sites), or basing the performance on the highest subsequent price (as do many sites). We also deal mostly in stocks with reasonable trading liquidity and unlike many sites, we certainly do not in any way attempt to force the prices of our Picks up through promotion (some Sites do that with penny stocks). We honestly show you all the results including the editor’s personal results.
We show you the good picks and (unlike most others) we show you our bad calls as well.
FUTURE RETURNS MAY NOT BE SIMILAR TO PAST RETURNS.
Past performance is no guarantee of future performance nor is it necessarily in any way indicative of future performance.
Measuring performance is somewhat difficult given that a stock originally rated a Strong Buy may later change to a weak buy or even occasionally to a sell.
We have attempted to show performance in the most honest and transparent fashion possible.
Our performance is tracked on a calendar year basis. For the start of each year we review all the ratings to make sure they are valid as of January 1 each year. The first few years were tracked a bit differently as detailed below.
Year 2000 performance includes only all those stocks that had an active rating as of January 1, 2000. Year 2000 performance shows the changes in price from the rating that was made closest to but not later than January 1, 2000 through to the rating made closest to but prior to December 31, 2000. Stocks which were no longer covered were priced through to December 31, 2000. It is fair to use the stock price on the day it was rated rather than using the exact calendar year. So, year 2000 performance is not exactly calendar 2000 but it is reasonably close.
The same process was followed for 2001, the beginning price for 2001 is the ending price used for 2000. Again, for 2002, the beginning price is the ending price from 2001. For 2003 and all years after that the performance is tracked with the calendar year price change.
Shawn Allen, CFA, CMA, MBA, P. Eng.
President
InvestorsFriend Inc.