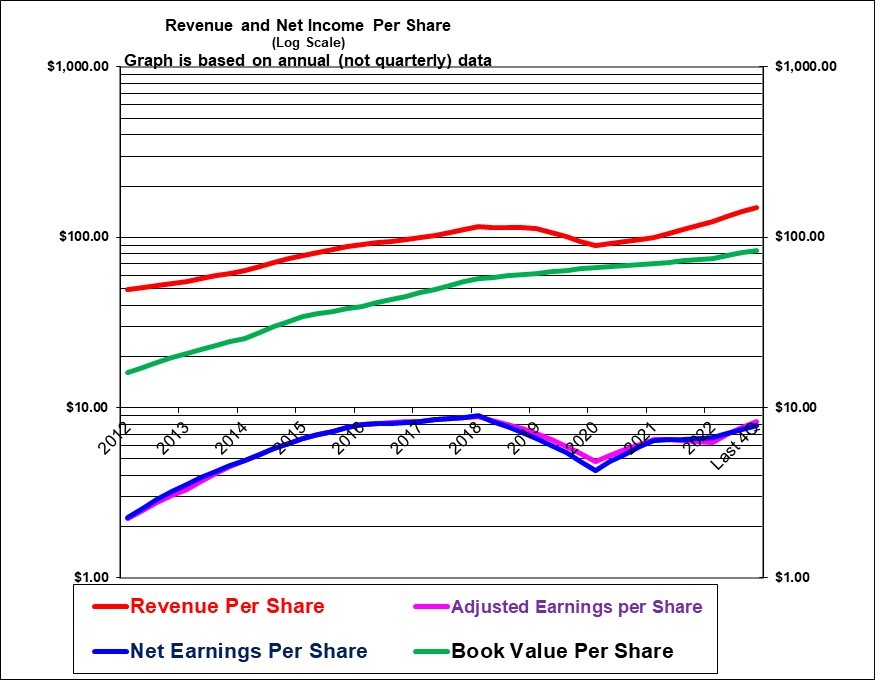
The downturn in revenues and, more so, earnings in starting in 2019 was reflective of lower auto production and general weakness in the markets for Linamar’s products exacerbated by the pandemic. Revenues have been recovering since late 2020 and have surpassed the old highs. Earnings per share recovered more slowly but have accelerated sharply in the latest five quarters although that’s not fully apparent on the chart. The earnings per share have not yet quite reached the old highs but are expected to in 2024
| Linamar Corporation | |
| RESEARCH SUMMARY | |
| Report Author(s): | InvestorsFriend Inc. Analyst(s) |
| Author(s)’ disclosure of share ownership: | The Author(s) hold shares |
| Based on financials from: | Dec ’22 Y.E. + Q3 ’23 |
| Last updated: | February 11, 2024 |
| Share Price At Date of Last Update: | $ 65.33 |
| Currency: | $ Canadian |
| Generic Rating (This rating does not consider the circumstances of any individual investor and is therefore not specific advice for any individual): | Buy at $65.33 |
| Qualifies as a stock that could be bought with confidence to hold for 20 years? | Yes |
| Has Wonderful Economics? | Yes, historically although cyclic |
| Has Excellent and Trustworthy Management? | Yes |
| Likely to grow earnings per share at an attractive rate over the next decade? | Yes |
| Positive near-term earnings outlook? | Yes (Modest decline Q4, double digit growth 2024) |
| Valuation? | Quite Attractive |
| SUMMARY AND RATING: The graph of revenues per share (red line) shows very strong growth from 2012 to 2018 and then a flattening in 2019 and a noticeable decline in 2020 due to the pandemic but then a strong recovery since then. Earnings per share grew sharply from 2012 to 2016 with positive but slower growth in 2017 and 2018 and then a sharp decline in 2019 and 2020. The recovery in earnings had been slow but has accelerated sharply in the past five quarters. The Value ratios would support a (higher) Buy rating. Management quality appears to be excellent. They are ambitious for growth and they execute well. The insider trading signal is neutral to moderately positive. Executive compensation is high but not of any big concern. They are projecting a 4% earnings decline in Q4 but double digit growth in 2024. The long-term outlook is positive. Linamar appears to have strong economics as a business over the long term. Manufacturing tends to be a tough industry. Overall, based on its valuation and quality but tempered by the cyclic and tough nature of the industry we would rate this as a Buy at $65.33. It has been a cyclic and volatile stock and we should expect that to continue. But it should do reasonably well over the years. It provides the opportunity to buy into a profitable (the recent ROE at 10.5% is acceptable and may be set to accelerate to higher historic levels) and well managed company with great management by paying only 78% of book value. Buying it at under book value has often worked out well in the past but it does have a history of often trading at less than book value. | |
| MACRO ENVIROMENT: Higher interest rates and a potential recession are headwinds. | |
| LONG TERM VALUE CREATION: (Updated for Q3 2023) Linamar has created substantial value since it was formed in 1966. Each dollar of invested equity it now holds has a book value of $29.92 and that is after paying out its modest dividend. The market value of the equity per dollar is currently somewhat lower at $23.27. Its ROE has averaged 16% over the ten years ending 2022 but is recently lower at 10.5% but may be set to recover. Book value per share has more than quadrupled over the past ten years. | |
| DESCRIPTION OF BUSINESS: Updated, Spring 2023. Linamar describes itself as a diversified global manufacturing company of highly engineered products. Its products become components of vehicles for engine, transmission, driveline and body systems. The company has over 3600 advanced robots which illustrates the high-tech nature of this company. It has five operating divisions: Machining & Assembly, Light Metal Casting, Forging, Skyjack (which makes scissor lifts – aerial work platforms, telehandlers and booms) and MacDon (which makes certain harvesting equipment). As of Q1, 2023 it had 28,800 employees in 66 manufacturing locations, 14 R&D centers and 28 sales offices in 11 countries. Annual revenues are currently over $8.4 billion and assets are $9.0 billion. Transportation Mobility (automotive / powertrain) division accounted for 76% of revenues and 66% of operating earnings with the Industrial division (Skyjack and MacDon agricultural) accounting for 24% of revenues and 36% of operating earnings. In 2022 sales were 52% in Canada, 26% to Europe, 13% to the U.S. and Mexico together and 8% to Asia/Pacific. With an equity value of $4.0 billion it is not a particularly huge company. | |
| ECONOMICS OF THE BUSINESS: The economics of the business appear to be very good given with an average ROE of 16% over the past ten years although the ROE was lower at 9.9% in 2019 and was just 7.5% in 2020 due to the pandemic. It was then 10% in 2020 and 9% in 2022. It appears to be set to achieve a noticeably higher ROE in 2023. Its customers are somewhat reliant on it and cannot easily or quickly switch to alternate supplies in many cases. | |
| RISKS: Trade tensions are a risk. The main risks are probably competitive pressures in a cyclical industry. There are also likely risks regarding product liabilities. See the annual report for additional risks. | |
| INSIDER TRADING / INSIDER HOLDING: (Based on April1, 2023 to February 11, 2024) There was a modest amount of selling including the Nancy Stoddart the sister of CEO Linda Hasenfratz whose husband is a along time senior executive and director who sold substantial shares at about $57 in November and who has been selling substantial shares in recent years. Three others sold shares. The CEO Linda Hasenfratz bought 50,0000 shares in December at about $58. There were five others that bought modest amounts. Overall, the insider trading signal is neutral to moderately positive. | |
| WARREN BUFFETT’s CRITERIA: Buffett indicates that all investments must pass four key tests: the business is simple to understand and predict (marginal pass given it sells to industry not consumers and given the complexity of its products), has favorable long-term economics due to cost advantages or superior brand power (pass based on know-how and past performance), apparently able and trustworthy management (pass given the track record and their rational approach), a sensible price – below its intrinsic value (pass), Other criteria that have been attributed to Buffett include: a low debt ratio (pass, given its low debt level), good recent profit history (pass due to recent earnings recovery) little chance of permanent loss of the investors capital (pass) a low level of maintenance type capital spending required to maintain existing operations excluding growth (marginal pass as investments are needed as products evolve). | |
| MOST RECENT EARNINGS AND SALES TREND: Revenues and earnings per share became quite volatile with the pandemic. In the latest four quarters beginning with the most recent, Q3 of 2023, revenues per share were up 22%, 37%, 34%, and 38%. Adjusted earnings per share were up 19%, 57%, 79%, and 73%. In 2022 overall, revenues per share were up 24% but adjusted earnings per share were down 4%. Overall the recent revenue and earnings trend is very strong. Historic data: In 2021 overall, revenues per share were up 12% and earnings per share were down 32%. In 2020 overall, revenues per share were down 21% and adjusted earnings per share were down 32% — and that was despite a substantial benefit from government wage subsidies. In 2019 overall, revenues per share were down 2% and adjusted earnings per share were down 20%. In 2018, revenues per share were up 16% and adjusted earnings per share were up 6%. | |
| INDUSTRY SPECIFIC STATISTICS: Q3 vehicle production units up 8.9% and 11.3% year to date. North America production volume rose 9.5% in 2022 and rose just 1% in 2021 and declined 20% for the full year 2020. Linamar’s content per vehicle produced in North America in Q3 increased 2% and 6% year to date. It increased 17% in 2022 increased 20% and for 2021 overall increased 9% and in 2020 overall rose 5.9%. In Europe vehicle production units in the latest quarter (Q3 2023) were up 6% and 14% year to date. and in 2022 were flat and were down 5% and for 2021 overall were down 4% and in 2020 overall was down 21%. The content per vehicle in Europe in Q3 was up 13% and just 3% year to date. Content per vehicle up 17% in 2022 and was up 12% in 2021 and down 4.7% in 2020 overall. In Asia, which is a small part of their business, vehicle production was up 2% in Q3 and 7% year to date. The content per vehicle in Asia was down 9% in Q3 and down 8% year to date and was down 12.5% in 2022 and was flat in 2021. | |
| Earnings Growth Scenario and Justifiable P/E: The P/E based on the last four quarter is just 7.9 and based on analyst forecast earnings is 6.7. This suggests that the market is expecting (or at least pricing in) only modest growth, if any or possibly a decline. | |
| VALUE RATIOS: (Analysed at $65.33) The price to book ratio at 0.8 is quite attractive and is still quite attractive at 1.1 times after deducting goodwill and equivalent (it seems reasonable to assume that management did not overpay for the acquisitions associated with the goodwill to any great extent) . The dividend yield is minimal at 1.3% despite recent increases. The dividend represents only 10% of trailing year earnings indicating that the company has substantial capacity to further increase the dividend if they decide to. The trailing P/E ratio is very attractive at 7.9. The analyst forward P/E is very attractive at 6.7. The trailing ROE is good but not great at 10.5%. The earnings per share have had periods of rapid growth but declined significantly in 2019 and then more so in 2020 with the pandemic but then recovered somewhat in 2021 before turning lower again in the first half of 2022 but then turned sharply higher in the latest five quarters but is only back to the levels of 2018 and 2017 which is disappointing. Based on past earnings and assuming even modest growth , it appears that the intrinsic value is above the current share price. These value ratios, in isolation, would support a (higher) Buy rating based on the P/E and P/B but somewhat tempered by the relatively modest ROE. | |
| TAXATION: Nothing Unusual. | |
| SUPPORTING RESEARCH AND ANALYSIS | |
| Symbol and Exchange: | LNR, Toronto |
| Currency: | $ Canadian |
| Contact: | investor.relations@linamar.com |
| Web-site: | www.linamar.com |
| INCOME AND PRICE / EARNINGS RATIO ANALYSIS | |
| Latest four quarters annual sales $ millions: | $9,339.7 |
| Latest four quarters annual earnings $ millions: | $490.9 |
| P/E ratio based on latest four quarters earnings: | 8.3 |
| Latest four quarters annual earnings, adjusted, $ millions: | $518.3 |
| BASIS OR SOURCE OF ADJUSTED EARNINGS: As reported by management | |
| Quality of Earnings Measurement and Persistence: Earnings had been persistently and steadily growing from 2009 to 2018. But earnings declined 20% in 2019 and then declined a further 32% with the pandemic in 2020 before rising 36% in 2021 but then falling 4% in 2022 but will rise significantly in 2023. Reported earnings are high quality as evidenced by the strong cash flow. | |
| P/E ratio based on latest four quarters earnings, adjusted | 7.9 |
| Latest fiscal year annual earnings: | $426.2 |
| P/E ratio based on latest fiscal year earnings: | 9.6 |
| Fiscal earnings adjusted: | $400.5 |
| P/E ratio for fiscal earnings adjusted: | 10.2 |
| Latest four quarters profit as percent of sales | 5.5% |
| Dividend Yield: | 1.3% |
| Price / Sales Ratio | 0.44 |
| BALANCE SHEET ITEMS | |
| Price to (diluted) book value ratio: | 0.78 |
| Balance Sheet: (as of Q1 2023) The assets are comprised as follows: 34% is property, plant and equipment plus another 2% is software, 18% is purchased goodwill and equivalent intangibles, 14% is current accounts receivable, 18% is inventories which includes work in process, 10% is cash, 2% is deferred tax assets, the remaining 2% is other small items. These assets are supported as follows: 56% by common equity, 15% by debt, 24% by accounts payable (which can be said to more than finance the current receivables), 3% by deferred income taxes and 2% by other minor items. This is a very strong balance sheet. | |
| Quality of Net Assets (Book Equity Value) Measurement: The book value per share is likely conservatively stated. | |
| Number of Diluted common shares in millions: | 61.6 |
| Controlling Shareholder: As of the Spring of 2023 the founder, Linda Hasenfratz (CEO and daughter of the late founder) owns 33% of the shares and controls the company. | |
| Market Equity Capitalization (Value) $ millions: | $4,026.9 |
| Percentage of assets supported by common equity: (remainder is debt or other liabilities) | 544.1% |
| Interest-bearing debt as a percentage of common equity | 33% |
| Current assets / current liabilities: | 1.7 |
| Liquidity and capital structure: The company appears to have a strong balance sheet and strong liquidity. Debt is modest at 33% of the book equity level and a net debt to EBITDA ratio of 0.79 . Its cash flow generation has been strong although more modest in 2023 due to working capital items. | |
| RETURN ON EQUITY AND ON MARKET VALUE | |
| Latest four quarters adjusted (if applicable) net income return on average equity: | 10.6% |
| Latest fiscal year adjusted (if applicable) net income return on average equity: | 8.5% |
| Adjusted (if applicable) latest four quarters return on market capitalization: | 12.9% |
| GROWTH RATIOS, OUTLOOK and CALCULATED INTRINSIC VALUE PER SHARE | |
| 5 years compounded growth in sales/share | 4.6% |
| Volatility of sales growth per share: | Cyclical Growth |
| 5 Years compounded growth in earnings/share | -4.3% |
| 5 years compounded growth in adjusted earnings per share | -5.6% |
| Volatility of earnings growth: | Cyclical Growth |
| Projected current year earnings $millions: | not available |
| Management projected price to earnings ratio: | not available |
| Over the last ten years, has this been a truly excellent company exhibiting strong and steady growth in revenues per share and in (adjusted) earnings per share? | Yes, although cyclical |
| Expected growth in EPS based on adjusted fiscal Return on equity times percent of earnings retained: | 7.6% |
| More conservative estimate of compounded growth in earnings per share over the forecast period: | 4.0% |
| More optimistic estimate of compounded growth in earnings per share over the forecast period: | 8.0% |
| OUTLOOK AND AMBITIONS FOR BUSINESS: Linamar is projecting a 4% year-over-year decline in adjusted earnings for Q4 (to be reported in early March) after about five quarters of very strong growth. For 2024 they are projecting double digit adjusted earnings per share and revenue growth as well as strongly positive cash flows. | |
| LONG TERM PREDICTABILITY: The company has been very well managed and we would expect it to continue to grow in the long term. But it does operate in cyclic industries. It has a strong order book. | |
| Estimated present value per share: We calculate $76if growth is just 4% and the terminal P/E is 10. And $125 if earning were to compound up at 8% and the P/E rise to 14 after five years. The required rate of return in these calculations is 7%. | |
| ADDITIONAL COMMENTS | |
| INDUSTRY ATTRACTIVENESS: (These comments reflect the industry and the company’s particular incumbent position within that industry segment.) Michael Porter of Harvard argues that an attractive industry is one where firms are somewhat protected from competition based on the following four tests. Barriers to entry (pass, due to specialised knowledge and the cost to set up manufacturing). No issues with powerful suppliers (pass). No issues with dependence on powerful customers (fail, it may be highly dependent on a few key customers), No potential for substitute products (pass) No tendency to compete ruinously on price (pass, given the profitability). Overall this industry appears to be attractive for Linamar as an established incumbent. | |
| COMPETITIVE ADVANTAGE: Linamar’s competitive advantage likely rests in its accumulated know-how and its established business. It is likely difficult for its customers to switch suppliers. Linamar also likely has an advantage in superior top management. | |
| COMPETITIVE POSITION: We don’t not have market share figures. However, the company indicates that its agricultural MacDon division has a number one market share in all key products. Linamar indicates it ranks 33rd out of the top 100 automotive suppliers in North America and 65th out of the top 100 world wide. Therefore it is not a large player comparatively. | |
| RECENT EVENTS: Linamar recently made a number of acquisitions. On February 1, 2024 they closed a $640 million acquisition in their Agricultural division purchasing Bourgault a Saskatchewan company. This will increase Linamar’s assets by about 7% and is therefore a relatively significant acquisition. On November 1, 2023 they closed a small automotive components acquisition of US $64 million acquiring Mobex. On August 3 they closed the acquisition of three battery enclosure facilities in the U.S. for US $325 million. | |
| ACCOUNTING AND DISCLOSURE ISSUES: We found the disclosure and accounting to be very good in some ways but with some weaker areas. (A minor point is we would like to see clear disclosure of the diluted share count each quarter, but the share count has been quite stable so this is not of any real concern.) Throughout the report when they explain the reasons for changes they often list about five reasons but give no indication of the contribution from each reason – which is less than helpful. The details provided on auto production and content per vehicle are very good. They provide a separate detailed MD&A for Q4 which is helpful and which many companies do not do. In 2019 they started adjusting earnings for FX changes. They provide a historical summary of quarterly earnings which should include the normalized earnings figure but does not. | |
| COMMON SHARE STRUCTURE USED: Normal, one vote per common share | |
| MANAGEMENT QUALITY: Our impression is that management is of very high quality. The annual reports feature a lengthy letter from the CEO and Chief Operating Officer which demonstrate a confident and forward thinking management. It seems clear that management is very ambitious for growth including growth in profits and a return to a higher ROE. | |
| Capital Allocation Skills: It appears that Linamar has historically excellent capital allocation skills. With an historically high return on equity it has been wise to pay only a small dividend as it retains the great majority of earnings and has invested those retained earnings wisely. | |
| EXECUTIVE COMPENSATION: Updated Spring 2023. Executive compensation for the top five officers ranges from a modest $1.1 million (for the CFO) to $15.1 million for the CEO. Within this range it seems top-heavy. However, given the size of the company, executive compensation is of no great concern. | |
| BOARD OF DIRECTORS: (Updated May 2023) Warren Buffett has suggested that ideal Board members be owner-oriented, business-savvy, interested and financially independent. Linda Hasenfratz the daughter of the late founder is chair and CEO. There are just five other members. One is an executive V.P. of the company who started on the shop floor as a machinist and has been a director since 1999. Another is an accomplished CPA who joined the Board in 2014. Another is a retired CA who was also a President of a Canadian manufacturing company and has been on the Board since 2003. An addition in 2020 was is a executive with strong industrial experience. In 2022 an executive with the company joined the Board. Board compensation is relatively modest. In our view, this is a good Board with the owners in charge. It lacks the independence valued by corporate governance experts and perhaps lacks legal and international representation. But overall, we view this as a good Board and like its extensive manufacturing experience. But it is not likely a Board that would ever vote against the controlling CEO in any circumstance. It could probably benefit from adding more members. | |
| Basis and Limitations of Analysis: The following applies to all the companies rated. Conclusions are based largely on achieved earnings, balance sheet strength, achieved earnings per share growth trend and industry attractiveness. We undertake a relatively detailed analysis of the published financial statements including growth per share trends and our general view of the industry attractiveness and the company’s growth prospects. Despite this diligence our analysis is subject to limitations including the following examples. We have not met with management or discussed the long term earnings growth prospects with management. We have not reviewed all press releases. We typically have no special expertise or knowledge of the industry. | |
| DISCLAIMER: All stock ratings presented are “generic” in nature and do not take into account the unique circumstances and risk tolerance and risk capacity of any individual. The information presented is not a recommendation for any individual to buy or sell any security. The authors are not registered investment advisors and the information presented is not to be considered investment advice to any individual. The reader should consult a registered investment advisor or registered dealer prior to making any investment decision. For ease of writing style the newsletter and articles are often written in the first person. But, legally speaking, all information and opinions are provided by InvestorsFriend Inc. and not by the authors as individuals. The author(s) of this report may have a position, as disclosed in each report. The authors’ positions may subsequently change without notice. | |
| © Copyright: InvestorsFriend Inc. 1999 – 2024. All rights to format and content are reserved. | |