Canadian Tire Corporation Limited
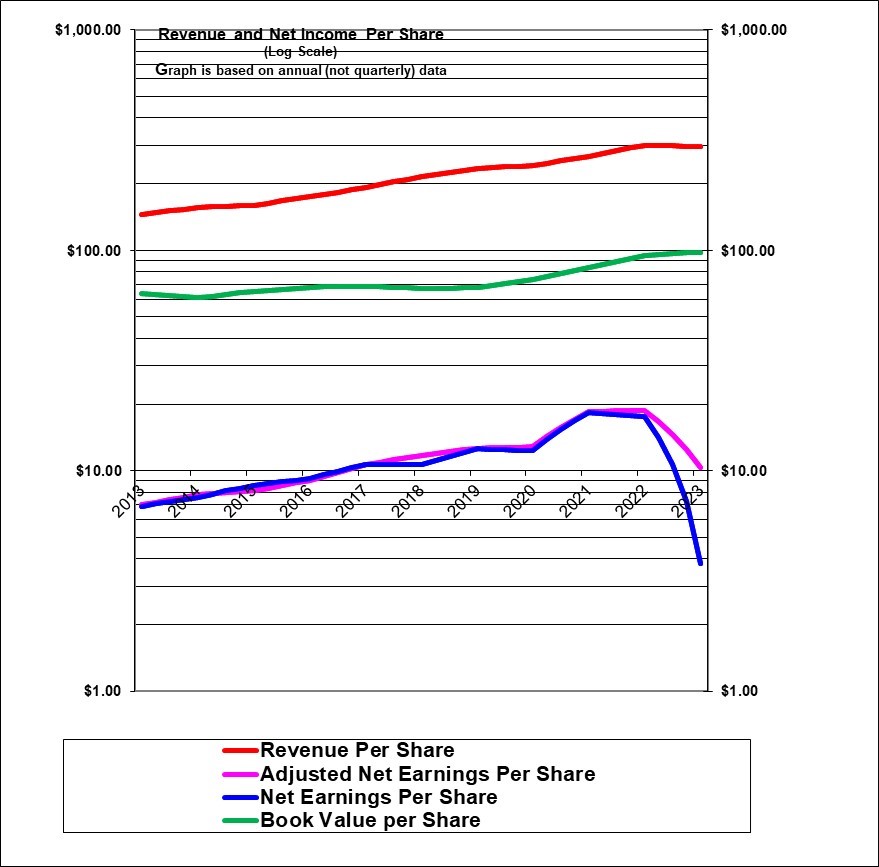
The chart shows that Canadian Tire’s earnings per share and revenues per share had increased quite steadily until 2020. Earnings flattened in calendar 2020 with the pandemic closures. Earnings soared in 2021 as people flocked to buy bicycles and do home projects. But adjusted earnings per share were flat in 2022 and then declined sharply in 2023. GAPP earnings (the blue line) declined even more sharply in 2023 but that was due to an accounting adjustment as they repurchase the minority ownership of their financial services from scotia Bank. That does not appear to be a “real” loss but more of an accounting requirement. Until 2023 the growth has been quite strong. Book value per share growth (the green line) has been quite modest due to very substantial share buy-backs. The share count is down by 25% in the past eight years. That has boosted the earnings per share but we (like Warren Buffett) view that as a very logical and legitimate strategy. The issue now is whether earnings will recover or much if any in 2024.
| Canadian Tire (CTC.a, TO) | |
| RESEARCH SUMMARY | |
| Report Author(s): | InvestorsFriend Inc. Analyst(s) |
| Author(s)’ disclosure of share ownership: | Author(s) hold shares |
| Based on financials from: | Dec ’23 Y.E. |
| Last updated: | February 2, 2024 |
| Share Price At Date of Last Update: | $ 140.01 |
| Currency: | $ Canadian |
| Generic Rating (This rating does not consider the circumstances of any individual investor and is therefore not specific advice for any individual): | Hold rated at $140 |
| Qualifies as a stock that could be bought with confidence to hold for 20 years? | Probably |
| Has Wonderful Economics? | Historically, yes |
| Has Excellent and Trustworthy Management? | Yes |
| Likely to grow earnings per share at an attractive rate over the next decade? | Yes |
| Positive near-term earnings outlook? | No |
| Valuation? | Neutral |
| SUMMARY AND RATING: This cell of the report summarizes information from cells below. Based on the graph, this qualifies as a moderately “Great Company” (strong and relatively steady past trend of earnings per share growth historically – although quite drop in 2023). Note that this graph rise 1000 fold from bottom to top and so what looks like a modest slope in earnings growth is actually fairly strong. The business has had quite good economics with a ten year average ROE of 16% as of 2022 but the 2023 ROE has fallen to 10.5%. The value ratios have deteriorated this year and now appear to support only a (lower) Buy or Hold rating. ADJUSTED earnings per share were down an average of 33% over the past three quarters. Part of this was explained by inefficiencies from a Distribution center fire that were not adjusted for, and part is the lower sales and there were higher interest casts. But the huge decline in earnings is difficult to understand. The industry is (or has been) moderately attractive (but could become unattractive if competition gets too intense). The recent sales trend is quite negative and earnings trend is VERY negative. Insider trading activity signal is moderately positive although based on only a few trades. The company has a strong history of growth revenues and mores so earnings have declined in recent quarters. The near-term outlook appears to be for continued weakness even in comparison to the weak quarters of 2023 due to a weaker economic environment and higher interest rates. Increased credit losses on their Mastercard business is a definite risk. Appears to do reasonably well on the factors that Warren Buffett looks for. Management seems very strong. Overall, we rate Canadian Tire a Hold at $140 based on being an historically strong company but which appears to facing continued weakness. The share price has declined significantly since last summer. | |
| MACRO ENVIRONMENT: Higher interest are a headwind due to their debt. Slowing sales as consumers face higher mortgage and grocery costs are also a headwind. Higher loan losses on their credit card operations due to economic conditions are also a headwind. | |
| LONG TERM VALUE CREATION: (Updated to Q3 2023) Canadian Tire has exhibited excellent long-term value creation. $595 million of invested equity (net of original capital returned in buybacks) has a book value of $5,063 million through the retention of earnings and this is net of substantial dividends and retained earnings paid out in share repurchases. The market values the equity at $7,824 million. The ten-year average ROE of 16% (ten years ending 2022) drives the value creation from a book value perspective and also drives the market premium to book value. | |
| DESCRIPTION OF BUSINESS: (Updated for Q4 2023) Operates three Retail chains totaling 1695 stores (502 Canadian Tire stores, 161 between Parts Source, pro hockey life and Party City, 371 SportChek and other sports stores, 380 Marks and 281 Gas bar locations. Also operates a large credit card operation and a wholesale specialty outdoor clothing operation (Helly Hansen). For the Canadian Tire stores acts as wholesaler and marketing arm and (in most cases) landlord. Canadian Tire (including its 69% owned REIT) owns about 70% of the Canadian Tire store buildings (leases the rest and leases all the stores for the other retail brands) but the independent dealers own the retail business and auto service business within each store. Canadian Tire controls the retail pricing. Party City has about 65 stores, PartSource has about 89 stores and ProHockey life about 16. Most of the Mark’s stores (L’Equpeur in Quebec), are company operated although some are franchisee operated. | |
| ECONOMICS OF THE BUSINESS: The economics of the Canadian Tire Stores seem good in that they have a huge penetration in Canada which provides economies of scale. The auto service business combined with automotive retail is unique. We do have some concern that the retail markup appears high reflecting a higher cost operation. They have a unique product mix that attracts customers. The Dealer structure with individual entrepreneurs owning each store is relatively unique. It does however mean that profits are shared. The Company is a wholesaler and landlord to these stores rather than a true retailer itself. The economics of the Sports stores are strong due to being the largest chain of sports stores in Canada. The Economics of the Marks stores seem strong based on brand awareness and a focus on work wear. The Economics of the credit card operation are strong because they have had a lower cost way to sign up customers through in-store promotions. The interest rate charges on credit card receivables is very high such that annual revenue is 23% of the amounts outstanding as receivables. Overall, (updated Q1 2023) the corporation makes a net bottom line 5.6% profit on revenue which is levered down to 4.4% on assets as assets are moderately larger than sales and leveraged up to an attractive and impressive 19.0% return on ending equity as assets are 4.3 times larger than equity. | |
| RISKS: See Annual report. Higher losses on the credit card business are likely given the current higher interest rates and possible recession. Amazon may pose a bigger threat at some point but to date has seemingly had minimal impact on Canadian Tire including the sports stores and Marks. | |
| INSIDER TRADING / INSIDER HOLDING: Checking “trades in the public market” from April 1, 2023 to February 18, 2024. There a modest amount of trading other than buying under a regular plan. The CEO bought 2550 shares August 29 at $156 and tow others bought modest amounts and one insider sold 2000 shares in November at $146. Overall, the insider trading signal is moderately positive. In terms of insider ownership, many insiders hold shares and buy on a regular basis through a plan that is independent of the share price. | |
| WARREN BUFFETT’s CRITERIA: Buffet indicates that all investments must pass four key tests: the business is simple to understand (pass ), has favorable long-term economics due to cost advantages or superior brand power (at least a marginal pass due to established brand power, scale, locations and entrepreneurial dealer structure), apparently able and trustworthy management (pass based on track record), a sensible price – below its intrinsic value (pass, the company is selling at a very attractive P/E), Other criteria that have been attributed to Buffett include: high profits on sales (pass good profits on sales for a retail operation) , a low debt ratio (pass), good recent profit history (pass) little chance of permanent loss of capital (pass) a low level of maintenance type capital spending required to maintain existing operations excluding growth (marginal pass as stores do require ongoing updating) | |
| MOST RECENT EARNINGS TREND: The earnings trend turned negative in 2022 after several years of very strong gains. In the past four quarters starting with the most recent (Q4 2023) and adjusted for a major accounting change in 2023, revenues per share were down 9% (blamed partly on the warm December weather) up 6% (largely due to a share count reduction), flat and flat. Revenues per share are impacted by volatile gasoline prices. Results have been boosted by share buy-backs. In Q1 2023 and as well Q2 there was some negative impact that was not adjusted for from a fire at a distribution center, there was also an expense in Q1 for terminating certain shipping contracts which was not adjusted for. Adjusted earnings per share were down 39%, down 24%, down 38% and down 90%!. 2023 annual revenues per share down 2% and adjusted earnings per share were down 45%. 2022 annual revenues per share were up 13% and adjusted earnings per share were up just 1%. In 2021, annual revenues per share were up 9% and adjusted earnings per share were up 45%. In 2020, annual revenues per share were up 4% and adjusted earnings per share were up 2%. In 2019 annual revenues per share were up 9% and adjusted earnings per share were up 8%. Overall the recent trend has turned quite negative. | |
| COMPARABLE STORE SALES: There has been a big softening in same-store sales recently. The Canadian Tire branded same-store sales in the past four quarters , starting with the most recent (Q4 2023) were down 6.9%! down 0.6%, up 0.1%, and down 4.8%. Sports stores were down 6.4%, down 7.4%, up 0.1%, and up 3.7%. Mark’s was down 7.2%, up 0.2%, up 0.4%, and up 4.8%. Helly Hanson revenue was down 9.2%, up 28%, down 2.9%, and up 23%. Gasoline comparable store volumes were down 1.4%, up 1.0%, up 2.3%, and up 2.8%. Overall, the level of same-store sales trend in recent quarters at the Canadian Tire stores has turned quite negative which, given inflation, suggests a very noticeable volume decrease. In 2023 overall, Canadian Tire same-store sales were up down 3.1%, SportChek was down 3.2%, Marks down 1.9%, Helly Hanson was up 7.1% and gasoline volume was down 0.8%. | |
| Earnings Growth Scenario and Justifiable P/E: At this update the shares were trading at an adjusted P/E of 13.5. The stock is pricing in relatively modest growth. | |
| VALUE AND GROWTH RATIOS: Analyzed at $140. The price to book value ratio is not excessive at 1.41. (This is definitely at the lower end of its usual range and it has often been around 2.5 which might suggests considerable upside). The dividend yield is attractive at 5.0% and reflects a pay-out ratio of 67% of trailing adjusted earnings combined with the 1.41 price to book ratio. Adjusted ROE has suddenly fallen to 10.5% from a recent 18%. Adjusted Earnings growth per share over the past 5 calendar years is now a decline of 2.5% after the plunge in 2023.%. Revenue per share growth was remains good at a compounded average of 6.4% in the past five years. Trailing 12 months adjusted P/E is neutral in attractiveness at 13.5. The analyst projected P/E is attractive at 10.6. Historically the P/E has usually been 12 to 15. Assuming that earnings grow for five years at an average of 3% to 8%, and the P/E ends higher at 10 or 14 respectively, then we calculate a present value per share of $117 to $188 (This is based on the low earnings of 2023). This valuation uses a discount rate of 7.0%. A higher “required” return or discount rate would lead to a lower calculated valuation today. Overall, these ratios, in isolation would support a (lower) Buy or Hold rating. | |
| TAXATION FOR SHAREHOLDERS: Nothing Unusual | |
| SUPPORTING RESEARCH AND ANALYSIS | |
| Symbol and Exchange: | CTC.a, TO |
| Currency: | $ Canadian |
| Contact: | investor.relations@cantire.com |
| Web-site: | www.canadiantire.com |
| INCOME AND PRICE / EARNINGS RATIO ANALYSIS | |
| Latest four quarters annual sales $ millions: | $16,656.5 |
| Latest four quarters annual earnings $ millions: | $213.3 |
| P/E ratio based on latest four quarters earnings: | 37.0 |
| Latest four quarters annual earnings, adjusted, $ millions: | $585.2 |
| BASIS OR SOURCE OF ADJUSTED EARNINGS: Adjusted for certain unusual (non-operating) items identified by management and starting in 2015 adjusted for gains on property sales. Also added back a one-time accelerated depreciation charge in 2018. And added back the 96 cents per share that management identified as unusual in 2020. | |
| Quality of Earnings Measurement and Persistence: As a retailer, the Earnings Measurement and Persistence are not very much affected by estimated items. The credit card operations must estimate bad debts. There have been relatively few “unusual” items in the Earnings Measurement and Persistence over the past few years. Overall, the reported Earnings Measurement and Persistence are of good “quality” (reliable, not as subject to manipulation). | |
| P/E ratio based on latest four quarters earnings, adjusted | 13.5 |
| Latest fiscal year annual earnings: | $213.3 |
| P/E ratio based on latest fiscal year earnings: | 37.0 |
| Fiscal earnings adjusted: | $585.3 |
| P/E ratio for fiscal earnings adjusted: | 13.5 |
| Latest four quarters profit as percent of sales | 3.5% |
| Dividend Yield: | 5.0% |
| Price / Sales Ratio | 0.47 |
| BALANCE SHEET ITEMS | |
| Price to (diluted) book value ratio: | 1.41 |
| Balance Sheet: Updated using Q3, 2023, Canadian Tire’s balance sheet is very different than a pure retailer because they have a very large finance operation that increases debt. It’s difficult to judge the debt level due to the retail / bank combination. Assets consist as follows: 30 are loans receivable mostly credit card receivables, 22% is property and equipment (mostly land and buildings also leasehold improvements and fixture – these are NOT marked to market and are likely worth FAR more than book value) 8% is capitalized leases, 15% is merchandise inventories, 10% is purchased goodwill or the equivalent 7% is trade receivables due – mostly from dealers and franchisees, 3% is cash and short-term investments, 2% is investment property (presumably REIT buildings not rented to Canadian Tire) and the remainder is various small items including prepaid amounts and some long term investments and deferred income tax asset. On the liability and equity side of the balance sheet these assets are funded as follows: Debt is 27%, deposits (remember, they own a bank) 14% – which is far lower than the 30% of assets that are loans, (Note that debt plus deposits is 41% of the asset level but debt for other than funding loans would be much lower), 10% capitalized lease liabilities, other long-term liabilities 5% (most of which appears to be minority interest in substance), 22% common equity and 6% the minority equity of Scotia Bank in the finance business and of the publicly traded portion of the REIT, 10% trade account payables. The remainder is a small amount of deferred income taxes and other “provisions” and liabilities. Overall, this is a strong balance sheet especially considering that the large credit card operation which is typically a highly leveraged business | |
| Quality of Net Assets and Book Value Measurement: With the share price recently trading at about 1.55 times book value and with substantial property assets not marked to market and the value of the assets can provide some protection against share price drops. The assets are strong, while there is some intangible assets and goodwill and there is almost certainly substantial unrecognized (in the consolidated balance sheet) value in the land assets and also probably in the market value of the credit card operation. Considering the break-out of the balance sheet assets and liabilities discussed nearby in this report, the book value is very solid and also the leverage seems modest after netting out deposits and debt associated with the credit card receivables. | |
| Number of Diluted common shares in millions: | 55.8 |
| Controlling Shareholder: (May 2023) Founding family member Martha Billes controls 40.9% of the voting shares. Owen Billes controls 20.5% of the voting shares. The Dealers association owns 20.6% of the voting shares and the profit sharing plan owns 12.2% of the voting shares. This ownership has been unchanged for some years. This leaves only about 6% of the voting shares available for trading. However non-voting shares also trade and are the main trading shares by far. The “non-voting” shares as of recent years now elect three directors. | |
| Market Equity Capitalization (Value) $ millions: | $7,807.2 |
| Percentage of assets supported by common equity: (remainder is debt or other liabilities) | 25.2% |
| Interest-bearing debt as a percentage of common equity | 116% |
| Current assets / current liabilities: | 1.8 |
| liquidity and capital structure: Overall liquidity is quite strong and the debt credit rating is good at BBB after having been down-graded in 2020 as a result of COVID-19. We had expected the credit rating to be restored to BBB+ but that is now likely delayed given the weaker outlook and given the recent borrowing to buy back the 20% of financial services from Scotia Bank. | |
| RETURN ON EQUITY AND ON MARKET VALUE | |
| Latest four quarters adjusted (if applicable) net income return on average equity: | 10.5% |
| Latest fiscal year adjusted (if applicable) net income return on average equity: | 10.5% |
| Adjusted (if applicable) latest four quarters return on market capitalization: | 7.5% |
| GROWTH RATIOS, OUTLOOK and CALCULATED INTRINSIC VALUE PER SHARE | |
| 5 years compounded growth in sales/share | 6.4% |
| Volatility of sales growth per share: | moderate but very steady growth |
| 5 Years compounded growth in earnings/share | -18.7% |
| 5 years compounded growth in adjusted earnings per share | -2.5% |
| Volatility of earnings growth: | Strong growth, some volatility |
| Projected current year earnings $millions: | not available |
| Management projected price to earnings ratio: | not available |
| Over the last ten years, has this been a truly excellent company exhibiting strong and steady growth in revenues per share and in (adjusted) earnings per share? | Yes |
| Expected growth in EPS based on adjusted fiscal Return on equity times percent of earnings retained: | 3.5% |
| More conservative estimate of compounded growth in earnings per share over the forecast period: | 3.0% |
| More optimistic estimate of compounded growth in earnings per share over the forecast period: | 8.0% |
| OUTLOOK AND AMBITIONS FOR BUSINESS: Canadian Tire had basically been firing on all cylinders for many years. But beginning around mid 2022 and throughout 2023 business has been noticeably weaker and significantly weaker in Q4. The Macro environment is challenging as consumers face inflation and cut back on discretionary spending. Some quarters in 2024 may show a decline although the weak comparable from 2023 will help. Dealer orders were apparently down quite noticeably in Q4 and it appears that management is expecting weakness in Q1 and Q2 as well. Any given quarter can be affected by weather and gasoline margins or other unusual items. Also potential higher credit losses in the credit card operation are always possible although there has been little sign of that so far. | |
| LONG TERM PREDICTABILITY: Canadian Tire has a long history of growing at relatively good rate. It does face increased competition including from Amazon. But it is in stable businesses and it seems reasonable to predict that it will continue to grow over the years. | |
| Estimated present value per share: We calculate $117 if adjusted earnings per share grow for 5 years at the more conservative average rate of 3% and the shares are then sold at a P/E of 10. And $188 if earnings per share grow at the optimistic average rate of 8% annually for 5 years and the shares are then sold at a higher P/E of 14. (This is not a share price prediction). Both estimates use a 7.0% required rate of return. But this calculation is based on the low earnings of 2023. | |
| ADDITIONAL COMMENTS | |
| INDUSTRY ATTRACTIVENESS: (These comments reflect Canadian Tire’s incumbent position in the industry.) Michael Porter of Harvard argues that attractive industries are those that are relatively protected from competition based on 5 key tests or forces. Retailing and Auto repair have only moderate barriers to entry in terms of attractive physical locations (marginal pass). Not subject to powerful suppliers (pass) Not subject to powerful customers – while the dealers are customers, they are captive customers (pass) . Generally no substitute products for the industry as a whole, people have to buy the products someplace (pass). Retail is sometimes thought of as competing excessively on price, but many retailers refuse to play that game and unlike capital intensive industries they will not tend to sell below cost level but clearly there is stiff competition in some of the basic household staples (marginal pass). Overall, these factors suggest it is at least a moderately attractive industry for Canadian Tire. | |
| COMPETITIVE ADVANTAGE: Entrepreneurial nature of dealer owned stores is probably an asset although it means sharing profits with them, convenient store locations, unique mix of products and services under one roof. Gas Bars have the advantage of offering Canadian Tire “Money”. Gas bars help to attract customers into the stores. The Finance operation is able to attract card holders at a low acquisition cost with in-store promotions. Scale provides advantages in advertising. Strongly “goal oriented” with a longer term history of exceeding its goals. In retail its overall gross margin including the margin of dealers appears to be high. We can’t judge how competitive this is without a break-down of margins by banner, Canadian Tire, Marks and the former Forzani stores. We suspect the gross margin for the Canadian Tire retail operation is much lower than the for the other two chains which have much smaller stores on average. | |
| COMPETITIVE POSITION: Canadian Tire Stores as well as SportChek and its other sports stores have a leading position but we don’t know the market share. The other divisions (Mark’s, Helly Hanson, petroleum and Finance) would have relatively modest shares of the total Canadian Market. | |
| RECENT EVENTS: The Q4 revenues per share were down a disappointing 9% and adjusted earnings per share plummeted 64%. Revenues were down due to warm December weather and the Canadian Tire store dealers cut back sharply on ordering inventory. With the Q3 earnings release they announced a 3% stall layoff and announced a smaller stock repurchase program as they see a slower year ahead. On October 31, 2023 they announced that they are buying back the 20% share of their credit card operation that was sold to Scotia Bank in 2014. They did have to pay a control premium to acquire it. The purchase resulted in an accounting loss but we don’t think that was a real loss in substance. In May 2023 announced a partnership whereby Canadian Tire Triangle rewards can now be earned at Petro Canada gas stations (over 1500 stations) and over 200 Canadian Tire gas stations will be re-branded to Petro Canada while still owned by Canadian tire. In late 2023 a modest 1.4% dividend increase was announced. In early 2023 the dividend was increased by 6%. In the Spring of 2022, the dividend was increased by 25%! They are currently offering an annual fee product through the Triangle rewards program offering bigger savings. There has been a big focus on e-commerce and their new triangle loyalty program. Canadian Tire is recently more focused on integrating its various retail chains with its “one company, one customer” approach. This includes its “Triangle” loyalty program across all banners. Also recently more focused on building its own brands and has created a new division to manage its brands. Over one third of retail sales – 36% in Q1 2023 (presumably excludes gasoline) now come from its own brands. The company has also been very aggressive in buying back shares which has been a boost to earnings per share. | |
| ACCOUNTING AND DISCLOSURE ISSUES: No major issues at this time but the existence of the partly owned REIT and the existence of the large finance operation create complexities. Their approach to what items to adjust for in normalized earnings was sometimes questionable with some unusual items not adjusted for but overall it is not a big concern. The change in the timing of recognising the Margin to be shared with dealers has a large impact on reported earnings in each quarter of 20123 and some impact on revenues timing as well. | |
| COMMON SHARE STRUCTURE USED: Unfortunately the main trading shares are non-voting. The voting shares also trade, but at a significant premium. All else being equal, this share structure is a negative factor. Based on reading the description of the shares (and particularly what would happen in the event of a take-over offer) we don’t think the voting shares should trade at a premium, but they do, and have for many years. We would buy the non-voting shares. | |
| MANAGEMENT QUALITY: Management appears to be very strong. Listening to their Q3 2023 conference call, I was very impressed. They seem to have a focus on relentless modest but steady improvements and growth. Despite their historical success they exhibit a hunger to grow and improve. A focus on shareholder value and return on equity through more cautious capital spending and better control of working capital is encouraging. Seems to have strong abilities in the finance business including the Canadian Tire MasterCard and the use of securitization of receivables. The quality of the earnings report is indicative of more intelligent management that really knows its key success factors. We are concerned that some more recent aggressive share buy backs were apparently being done without regard to the share price. A possible concern is that its overall costs of operations may be too high. They seem to require a relatively higher retail gross margin than some competitors. It seems that management has proven its ability to make profitable acquisitions. Management has also shown an ability to “surface” value with its partial sale of the REIT and finance (credit card) segment transactions. Their success in maintaining margins in the face of the lower Canadian dollar and without increasing prices back in 2015 and 2016 was remarkable. | |
| Capital Allocation Skills: Canadian Tire has demonstrated excellent skills in capital allocation. They have made some large acquisitions (Marks then Forzani) which have worked out very well. The establishment of a separate REIT while retaining some 85% (reduced to 76% in Q4 2018 and to 69% in 2019) appears to have been a positive move in surfacing value. The wisdom of the sale of 20% of the credit card operation is difficult to know. The wisdom of the Helly Hanson purchase also remains to be fully seen as does the acquisition of Party City – although the Helly Hanson revenues are up sharply suggesting this was likely a good purchase. | |
| EXECUTIVE COMPENSATION: In 2022 compensation was about $1.9 to $2.4 million for four of the five top seven officers and $6.54 million for the CEO. This is relatively modest compensation for those other than the CEO. This level of compensation is consistent with the company’s values and respect for its share owners I believe. | |
| BOARD OF DIRECTORS: Updated May 2023. Directors are expected to hold shares but they mostly obtain these as compensation. This practice aligns interests with outside shareholders but eliminates the ability to conclude that share purchases by directors are a positive indication regarding expected share price. Three directors are Canadian Tire Dealers. Two directors are from the founding family. Three additional directors are elected by holders of the “non-voting” shares. Other than the two members of the founding family, none of the directors own very substantial amounts of shares including deferred share units. Plus or minus 1 million dollars worth is typical. They do hold modest amounts of deferred share units given to them as compensation. We like the founding family Board members and overall it does appear to be a strong Board with strong experience. One of the three “non-voting” share nominees received only 50.4% votes in favor in 2022 and yet he was kept on as a Board member and nominated again in 2023. This seems like a disregard of shareholder wishes but he did recover to 72% in favor in 2023. | |
| Basis and Limitations of Analysis: The following applies to all the companies rated. Conclusions are based largely on achieved earnings, balance sheet strength, achieved earnings per share growth trend and industry attractiveness. We undertake a relatively detailed analysis of the published financial statements including growth per share trends and our general view of the industry attractiveness and the company’s growth prospects. Despite this diligence our analysis is subject to limitations including the following examples. We have not met with management or discussed the long term earnings growth prospects with management. We have not reviewed all press releases. We typically have no special expertise or knowledge of the industry. | |
| DISCLAIMER: All stock ratings presented are “generic” in nature and do not take into account the unique circumstances and risk tolerance and risk capacity of any individual. The information presented is not a recommendation for any individual to buy or sell any security. The authors are not registered investment advisors and the information presented is not to be considered investment advice to any individual. The reader should consult a registered investment advisor or registered dealer prior to making any investment decision. For ease of writing style the newsletter and articles are often written in the first person. But, legally speaking, all information and opinions are provided by InvestorsFriend Inc. and not by the authors as individuals. The author(s) of this report may have a position, as disclosed in each report. The authors’ positions may subsequently change without notice. | |
| © Copyright: InvestorsFriend Inc. 1999 – 2024. All rights to format and content are reserved. | |