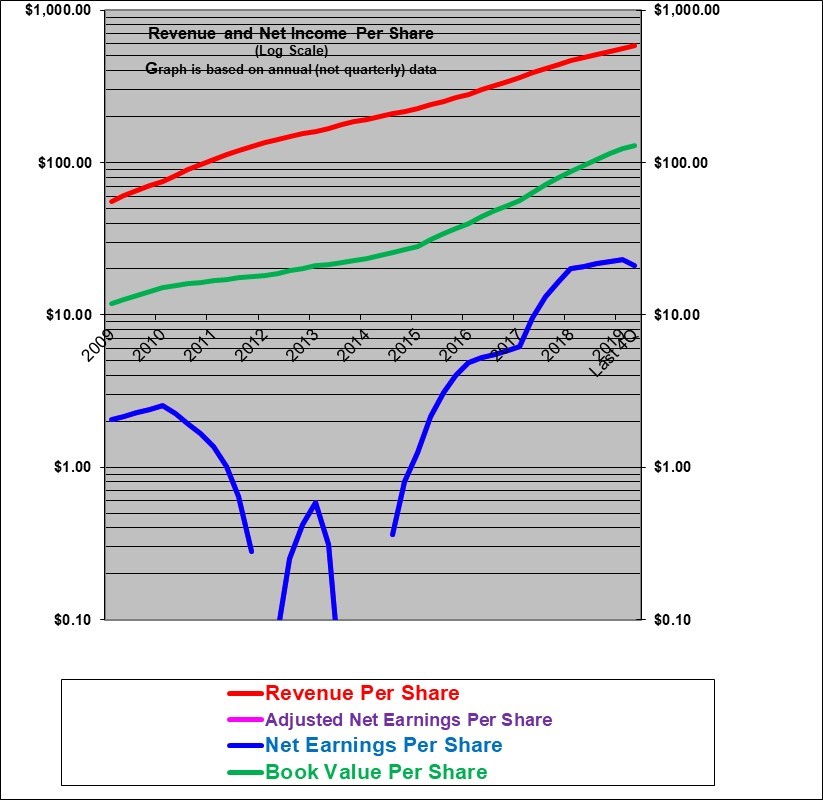
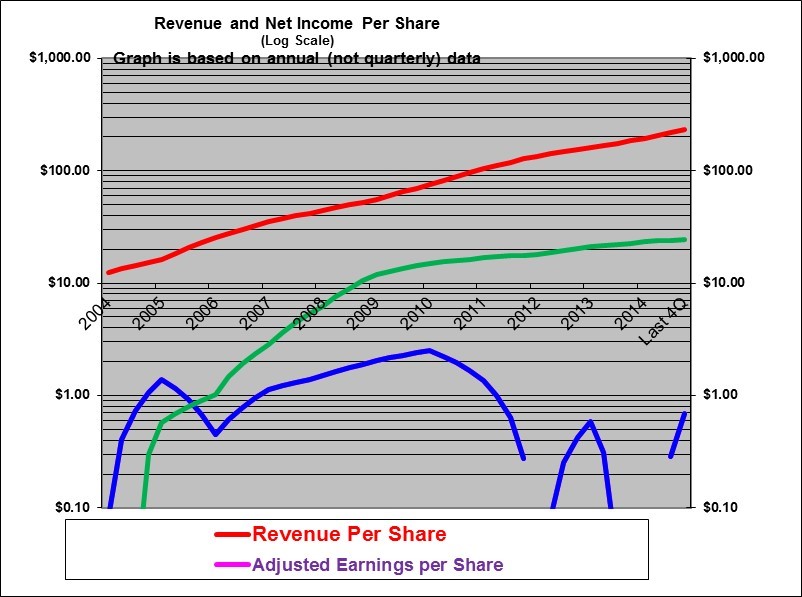
The graph of revenues per share (red line) shows that the revenue per share have grown at a very strong and steady rate (compounding at an average 26% per year in the ten years shown). The book value per share has grown at the high average annual rate of 26% but that was partly due to the issuance of shares (largely as compensation and also in acquisitions) at very high multiples to book value, but more recently is partly due to the retention of earnings. GAAP earnings per share have increased but remain low in relation to the $2660 share price. There was a particularity sharp increase in earnings in 2018 but then more moderate growth in 2019 and a decline in the first quarter of 2020. GAAP earnings may be substantially under-stating the “true” earnings due to accounting rules.
| Amazon.com Inc. | |
| RESEARCH SUMMARY | |
| Report Author(s): | InvestorsFriend Inc. Analyst(s) |
| Author(s)’ disclosure of share ownership: | The Author(s) hold no shares |
| Based on financials from: | Dec ’19 Y.E. +Q1 ’20 |
| Last updated: | June 10, 2020 |
| Share Price At Date of Last Update: | $ 2,660.00 |
| Currency: | $ U.S. |
| Generic Rating (This rating does not consider the circumstances of any individual investor and is therefore not specific advice for any individual): | Weak Buy / Hold at $2660 |
| Qualifies as a stock that could be bought with confidence to hold for 20 years? | Yes |
| Has Wonderful Economics? | Yes |
| Has Excellent and Trustworthy Management? | Yes |
| Likely to grow earnings per share at an attractive rate over the next decade? | Yes |
| Positive near-term earnings outlook? | Yes, after Q2 |
| Valuation? | Quite Expensive |
| SUMMARY AND RATING: The graph of revenues per share (red line) shows that the revenue per share have grown at a very strong and steady rate (compounding at an average of an astounding 26% per year in the ten years shown). It seems very likely that GAAP earnings per share substantially under state the true economic earnings due to the expensing of large amounts of technology staff costs and also marketing costs which are likely creating long term value but we have no basis on which to calculate adjusted earnings. Also losses in the International Segment are likely temporary but meanwhile reduce the reported earnings. GAAP earnings per share have historically been erratic and remain relatively low in relation to sales at 3.6% but this figure had been rising sharply but then fell more recently. The Value ratios based on GAAP earnings are difficult to interpret and at 127 times trailing earnings and 71 times forward earnings it would be hard to justify a Buy rating. Management quality appears very high although in the past it was not clear when management would show interest in achieving significantly higher GAAP earnings but recently earnings have risen rapidly (but did fall in the latest quarter). The insider trading signal is weak but somewhat negative. The company itself has not bought back any shares since 2012. Executive compensation is almost entirely in the form of shares and is not a concern given the size of the company. The outlook for revenue growth is very strong. Amazon is forecasting revenue growth of 18 to 28% in this Q2 but approximately zero earnings due to COVID-19 spending. Amazon has strong competitive and cost advantages. Amazon is a powerful and game-changing company that is worth watching. Overall we would rate this as a Weak Buy / Hold at this time. | |
| LONG TERM VALUE CREATION: (updated Q1 2020) Amazon has clearly been a suburb creator of value. On a market value basis, each dollar the company has taken in by issuing shares is now worth $40. On a book value basis each dollar taken in from share issuances is worth $1.94. Most of these dollars taken in came from the value of compensation paid in shares and so on a weighted average basis Amazon has probably only been holding these dollars for a few years. | |
| DESCRIPTION OF BUSINESS: (Last updated from fiscal 2019 results) Amazon.com Inc. is (largely) an internet-based company. Amazon strives to be the world’s most customer-centric company and focuses on wide selection, low prices and convenience. Major revenue sources include i) the sales of products as an online retailers (electronics, books and general merchandise) ii) facilitating others to sell their products through Amazon for a service fee, iii) the sale of proprietary electronics that it manufactures (Kindle, Fire Tables, FIRE TV and Echo including the Alexa operating software) and iv) the provision of web-based storage and services to businesses (Amazon Web Services) v) streaming music and video services. The company indicates that it is guided by four principles. 1. Customer obsession rather than competitor focus, 2. passion for invention, 3. commitment to operational excellence, and long-term thinking. The employee count was 798,000 full and part time at the end of 2019 (not counting temporary workers and contractors). In 2019 revenue was 12% from Amazon Web Services (AWS) 61% from North America (excluding AWS) and 27% from international (excluding AWS). Amazon Web Services accounted for 63% of operating profit, International accounted for minus 12% of operating profit and North America (excluding AWS) accounted for 48% of operating profit. It seems likely that the losses in International will be temporary. Amazon’s profits would rise if International were operating at breakeven or higher. | |
| ECONOMICS OF THE BUSINESS: The GAAP earnings have historically been too low but recently increased sharply. We suspect that the underlying economics are very strong. | |
| RISKS: See annual report. The biggest risks are likely technology and competition. Income taxes are likely to rise as the company has been paying low amounts of cash taxes. Sales taxes could also rise. | |
| INSIDER TRADING / INSIDER HOLDING: The top officers have a history of selling under automatic sale plans. This is understandable and provides little signal since they are paid almost entirely in stock options. They basically have to sell shares to obtain money to live on. Still, the constant selling has to be considered to be a somewhat negative indicator. | |
| WARREN BUFFETT’s CRITERIA: Buffett indicates that all investments must pass four key tests: the business is simple to understand and predict (marginal pass at best as it is large and complex and getting more so), has favorable long-term economics due to cost advantages or superior brand power (pass due to tremendous brand power and economies of scale), apparently able and trustworthy management (pass), a sensible price – below its intrinsic value (fail or unable to determine), Other criteria that have been attributed to Buffett include: a low debt ratio (pass), good recent profit history (pass) little chance of permanent loss of the investors capital (marginal pass) a low level of maintenance type capital spending required to maintain existing operations excluding growth (pass) | |
| MOST RECENT EARNINGS AND SALES TREND: GAAP earnings per share growth in the past four quarters, starting with the most recent (Q1, 2020) was minus 29% (lowered somewhat by pandemic spending) , plus 7%, minus 26%, and plus 2%. In 2019, earnings per share were up 14%. GAAP earnings per share probably significantly under-state the value creation due to expensing technology and marketing expenses which in past will benefit future years. Revenue per share growth in the same past four quarters, starting with the most recent, (Q1 2020) has been 26% (boosted by pandemic surge) 26%, 22%, and 18%. Revenues per share grew by 24% in 2019, 29% in 2018, 28% in 2017, 25% in 2016 16% in 2015 and 20% in 2014. Therefore the revenue per share trend is very strong. Earnings per share grew 14% in 2019, a massive 228% in 2018, 26% in 2017 and 292% in 2016. The recent earnings per share trend is quite strong despite a decline in the latest quarter. | |
| INDUSTRY SPECIFIC STATISTICS: | |
| Earnings Growth Scenario and Justifiable P/E: The trailing P/E ratio of 127 is pricing in tremendous growth in earnings and/or suggests that current earnings are vastly under-stated. As an example, Earnings growth of 35% annually for five years and a terminal P/E of about 40 in five years would justify the current share price. | |
| VALUE RATIOS: Analysed at a price of $2660. The price to book value ratio is ostensibly very unattractive at 21 times. However, book value simply not of much or any relevance here. Based on GAAP earnings the trailing P/E is very unattractive at 127 but has declined very substantially from the levels of the past few years. The P/E based on analyst projected earnings is also quite unattractive at 71 but not as stratospheric as had been the case for some years. It may well be the case that GAAP earnings are vastly understated due to expensing vast amounts of technology spending and some marketing expenses that is in reality creating an enduring asset but we have no basis on which to make the adjustment. There is no dividend. The GAAP ROE is very attractive at 19%. The growth in revenue per share has averaged 24% per year in the past five years ending 2019 and was 20% in 2019. Earnings per share growth figures are not very meaningful due to volatility and a low base but have turned very sharply higher in the past several years. The share price is 4.5 times trailing year annual sales. These ratios, in isolation, are hard to interpret. It is very difficult to justify a Buy rating at 127 times trailing earnings or 71 times forward earnings. But, for many years Amazon has looked over-valued compared to earnings but has turned out to be an excellent investment. | |
| SUPPORTING RESEARCH AND ANALYSIS | |
| Symbol and Exchange: | AMZN, U.S. |
| Currency: | $ U.S. |
| Contact: | ir@amazon.com |
| Web-site: | www.amazon.com |
| INCOME AND PRICE / EARNINGS RATIO ANALYSIS | |
| Latest four quarters annual sales $ millions: | $296,274.0 |
| Latest four quarters annual earnings $ millions: | $10,592.0 |
| P/E ratio based on latest four quarters earnings: | 127.1 |
| Latest four quarters annual earnings, adjusted, $ millions: | $10,592.0 |
| BASIS OR SOURCE OF ADJUSTED EARNINGS: No adjustments were made | |
| Quality of Earnings Measurement and Persistence: Given that Amazon has a trailing P/E of 127 and a forward P/E of 71 it is important to consider if the true economic earnings are higher than the GAAP earnings. It is very possible that a large amount of the technology and content expenses and marketing expenses should really be capitalized as they create long-lasting value and in that sense earnings may be significantly under-stated. Indeed, Amazon refers to technology and content expenses as an investment. In addition, Amazon’s receives cash from customers before it has to pay its suppliers and also receives upfront cash from Prime customers. This cash is offset by a liability but given that the cash grows continually, should some of this be considered a form of earnings? The International segment is generating an operating loss – but is that a real loss or more a function of accounting? | |
| P/E ratio based on latest four quarters earnings, adjusted | 127.1 |
| Latest fiscal year annual earnings: | $11,588.0 |
| P/E ratio based on latest fiscal year earnings: | 116.2 |
| Fiscal earnings adjusted: | $11,588.0 |
| P/E ratio for fiscal earnings adjusted: | 116.2 |
| Latest four quarters profit as percent of sales | 3.6% |
| Dividend Yield: | 0.0% |
| Price / Sales Ratio | 4.54 |
| BALANCE SHEET ITEMS | |
| Price to (diluted) book value ratio: | 20.62 |
| Balance Sheet: (last updated Q1, 2020) Amazon is clearly valued for its earnings potential and not its assets. However it is instructive to understand the balance sheet and how the asset growth has been financed. Assets consist of 22% cash and marketable securities, 9% inventories, 8% accounts receivable and other current assets (for a total of 39% in current assets) 35% property and equipment (primarily equipment but also significant owned land and buildings), 12% capitalized leases, 7% goodwill and 7% “other”. These assets are supported on the liability and equity side of the balance sheet as follows: 18% accounts payable, 14% accrued expenses (some of this is lease payments due within one year, some is gift cards outstanding and some is for current debt and retirement obligations and other expenses accrued) 4% unearned revenue (apparently mostly PRIME membership fees) . This totals 36% current liabilities which largely finance the current assets such that Amazon does not need to finance much at all of the current assets). 18% long-term lease liabilities, 11% long-term debt, 6% other long-term liabilities, and 30% share holder equity of which only 52% is retained earnings and 48% is “paid in” money from share owners (mostly from compensation paid in shares and not representing actual cash collected). This is clearly a strong balance sheet. What is very interesting is that company has financed itself to a good degree through accounts payable, gift cards and the unearned revenue of PRIME memberships and web services paid for in advance. As long as these amounts continue to grow over the years they effectively are never paid back in the net and amount to a perpetual interest free loan to finance assets. A huge amount of the equity has come in through paying compensation in stock and does not represent actual cash collected. Assets have grown faster than equity. The use of debt is relatively modest. | |
| Quality of Net Assets (Book Equity Value) Measurement: Net equity is probably conservatively stated in that the assets are strong and there is a modest amount of liabilities that are relatively soft including deferred income taxes and unearned revenue. However, with the company valued at 21 times book value as of June 10, 2020, the reliability of the book value per share figure is not at all important. | |
| Number of Diluted common shares in millions: | 506.0 |
| Controlling Shareholder: Updated from the Spring 2020 circular. Founder and CEO Jeff Bezos owns 15.1% and effectively controls the company. He has sold shares over the years but also receives shares as options. The 15 executives and Board members aside from Bezos collectively own 285,000 shares (which is just 0.06% of the company) worth roughly $758 million (This would exclude the value of their options). On behalf of its investors. Vanguard owns 6.4% and BlackRock owns 5.4%. | |
| Market Equity Capitalization (Value) $ millions: | $1,345,960.0 |
| Percentage of assets supported by common equity: (remainder is debt or other liabilities) | 29.0% |
| Interest-bearing debt as a percentage of common equity | 36% |
| Current assets / current liabilities: | 1.1 |
| Liquidity and capital structure: The company has very good liquidity and a strong balance sheet. | |
| RETURN ON EQUITY AND ON MARKET VALUE | |
| Latest four quarters adjusted (if applicable) net income return on average equity: | 18.6% |
| Latest fiscal year adjusted (if applicable) net income return on average equity: | 21.9% |
| Adjusted (if applicable) latest four quarters return on market capitalization: | 0.8% |
| GROWTH RATIOS, OUTLOOK and CALCULATED INTRINSIC VALUE PER SHARE | |
| 5 years compounded growth in sales/share | 23.6% |
| Volatility of sales growth per share: | Strong and Steady |
| 5 Years compounded growth in earnings/share | negative past earnings |
| 5 years compounded growth in adjusted earnings per share | n.a. |
| Volatility of earnings growth: | Volatile but trending up |
| Projected current year earnings $millions: | not available |
| Management projected price to earnings ratio: | not available |
| Over the last ten years, has this been a truly excellent company exhibiting strong and steady growth in revenues per share and in (adjusted) earnings per share? | Yes |
| Expected growth in EPS based on adjusted fiscal Return on equity times percent of earnings retained: | 21.9% |
| More conservative estimate of compounded growth in earnings per share over the forecast period: | 20.0% |
| More optimistic estimate of compounded growth in earnings per share over the forecast period: | 40.0% |
| OUTLOOK FOR BUSINESS: Amazon has forecast year-over-year sales growth of 18 to 28% in Q2. Earnings are forecast to be near zero in Q21 due to COVID-19 spending. It seems clear that Amazon is going to continue to grow its revenues at a relatively high rate for a number of years. Given recent profit growth it now appears more likely that its profits will increase faster than sales (after Q2). Amazon has very much focused on growth in revenues and not growth in profits. This could continue for some years. | |
| LONG TERM PREDICTABILITY: Given its brand name and scale and its ambitions and past record, it can be predicted with confidence that Amazon will continue to grow its sales at a high rate. Profits may well grow at an even faster rate. | |
| Estimated present value per share: With a trailing year GAAP P/E of 127, it may be that the current earnings are still too low to form a basis for an intrinsic value calculation. Nevertheless, we have some numbers. And it seems very likely that earnings are higher on an adjusted basis but we have no basis on which to calculated adjusted earnings. If earnings per share rose at 20% annually for five years and the shares were then sold at a P/E of 30, the intrinsic value calculates as $1114. If earnings per share grow at 40% annually for five years (which may be a heroic or crazy assumption) and the P/E declines only to 40 the intrinsic value calculates as $3211. Perhaps what this illustrates as much as anything else is the old saying that “if you torture the numbers long enough they will confess to any answer you would like”. | |
| ADDITIONAL COMMENTS | |
| INDUSTRY ATTRACTIVENESS: (These comments reflect the industry and the company’s particular incumbent position within that industry segment.) Michael Porter of Harvard argues that an attractive industry is one where firms are somewhat protected from competition based on the following four tests. Barriers to entry (pass, scale provides a barrier to entry). No issues with powerful suppliers (pass). No issues with dependence on powerful customers (pass), No potential for substitute products (pass) No tendency to compete ruinously on price (fail, although Amazon seems to bring this on itself). Overall this industry appears to be attractive to Amazon as the established large incumbent. | |
| COMPETITIVE ADVANTAGE: Amazon’s scale, brand name and ambitions are advantages. It has cost advantages over traditional retail outlets, although shipping costs offset that to some degree. The recurring nature of most of its revenue streams either through customer loyalty or subscription revenue is a huge advantage. | |
| COMPETITIVE POSITION: We don’t have the figures, but Amazon clearly has a leading competitive position in online retailing and also in cloud web services. | |
| RECENT EVENTS: The recent events and progress at Amazon are too numerous to attempt to fully list here. Each quarter it lists an array of new developments and products and progress. Amazon continues to add greatly to its products, services and geographic reach. In 2020 sales soared due to the lockdown of most physical retail spaces. In late 2018 Amazon raised minimum wages to $15 per hour. During the pandemic it added an additional $2.00 and increased overtime pay rates. | |
| ACCOUNTING AND DISCLOSURE ISSUES: GAAP earnings may be understated due to the fact that a large amount of technology expenses including research and development efforts and also certain marketing expenses and the expenses to obtain PRIME customers will clearly benefit future years but these expenses are entirely deducted to reduce current earnings. Also the depreciation expense on software may be overstated if the software will last longer than the amortization period. If earnings are vastly understated then the accounting has not done its job due to being excessively conservative on the part of management and/or accounting rules. The balance sheet is quite condensed with not very good disclosure and break-out of some items. Similarly there is very little segmented information in the annual report. | |
| COMMON SHARE STRUCTURE USED: Normal, one vote per share. | |
| MANAGEMENT QUALITY: Led by founder Jeff Bezos, management has to be considered to be excellent. An area of concern in the past was an apparent lack of focus on profitability. Or possibly an accounting approach that has vastly under-stated earnings. There appears to be a stronger focus on earnings more recently. Bezos argues that free cash flow per share is most important. We agree. But he appears to have an incorrect view that stock options should not be seen as a reduction from profits and from the cash flow that accrues to investors. Management treats cash flow resulting from increased payables and from gift cards as the same as cash flow resulting from earnings. This becomes a form of “float” and has helped to finance growth. Overall, given the success of the company management has to be considered to be suburb. | |
| Capital Allocation Skills: Amazon appears to have shown good capital allocation skills by repurchasing shares at attractive prices in 2012 and prior to that. The company has not repurchased any shares since 2012. That seems prudent as the shares appeared expensive – but subsequent growth suggests that the shares were not over-valued despite their apparent high valuation. | |
| EXECUTIVE COMPENSATION: The founder and CEO, Jeff Bezos, takes essentially no compensation ($81,840 per year).Compensation for the other four named executives earn a token $175,000 per year plus stock awards that are shown as extremely variable from year to year such as $20 million some years and then zero for two years. The awards vest over several years. In any case, executive compensation is not a concern given the size and value and earnings of the company. | |
| BOARD OF DIRECTORS: (updated in 2020) Warren Buffett has suggested that ideal Board members be owner-oriented, business-savvy, interested and financially independent. In addition to founder Jeff Bezos, Amazon has 9 directors who collectively appear to be well qualified. They hold reasonably significant amounts of shares from $0.5 million for a recent director to $25 million for a long standing director. (And this would exclude the value of their share options). This sharpens their interest but makes some of them less independent. The directors receive no cash compensation but are rewarded with periodic stock option awards which lately appear targeted to compensate at about $600k annually. | |
| Basis and Limitations of Analysis: The following applies to all the companies rated. Conclusions are based largely on achieved earnings, balance sheet strength, achieved earnings per share growth trend and industry attractiveness. We undertake a relatively detailed analysis of the published financial statements including growth per share trends and our general view of the industry attractiveness and the company’s growth prospects. Despite this diligence our analysis is subject to limitations including the following examples. We have not met with management or discussed the long term earnings growth prospects with management. We have not reviewed all press releases. We typically have no special expertise or knowledge of the industry. | |
| DISCLAIMER: All stock ratings presented are “generic” in nature and do not take into account the unique circumstances and risk tolerance and risk capacity of any individual. The information presented is not a recommendation for any individual to buy or sell any security. The authors are not registered investment advisors and the information presented is not to be considered investment advice to any individual. The reader should consult a registered investment advisor or registered dealer prior to making any investment decision. For ease of writing style the newsletter and articles are often written in the first person. But, legally speaking, all information and opinions are provided by InvestorsFriend Inc. and not by the authors as individuals. The author(s) of this report may have a position, as disclosed in each report. The authors’ positions may subsequently change without notice. | |
| © Copyright: InvestorsFriend Inc. 1999 – 2020. All rights to format and content are reserved. | |